Shapes of Total Product, Marginal Product, And Average Product Curves (In short run) can be better understood by the following relationship between them.
Relationship between TP, AP and MP:
- When TP rises at increasing rate, Both MP and AP also rises but MP > AP.
- When TP is maximum, MP is zero.
- When TP rises at diminishing rate, both AP and MP decline but MP < AP.
- When TP declines, AP also declines and MP becomes negative (-).
- MP can be zero and negative but AP is never zero.
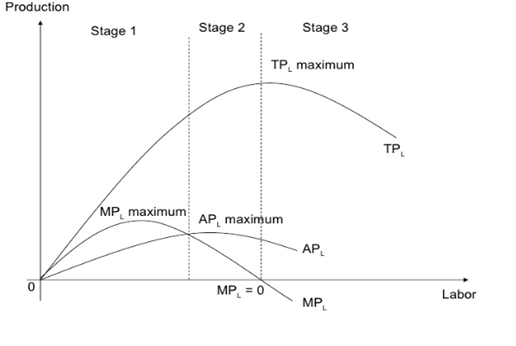
From the figure,
- In stage 1, TP is increasing at an increasing rate leading to both AP and MP increase.
- In Stage 2, TP is increasing at a diminishing rate leading to both AP and MP fall.
- In Stage 3, TP starts declining leading to decline in AP and MP becomes negative.


