 Short Answer Type
State different phases of the law of variable proportions on the basis of total product. Use diagram.
Or
Explain the geometric method of measuring price elasticity of supply. Use diagram.
Good Y is a substitute of good X. The price of Y falls. Explain the chain of effects of this change in the market of X.
Or
Explain the chain of effects of excess supply of a good on its equilibrium price.
Substitute goods refer to goods which can be consumed instead of each other. For example, tea and coffee are substitute goods. If X and Y are substitute goods, then a fall in the price of good Y will lead to a fall in the demand of good X. this is because with a fall in the price of good Y, it will become cheaper in comparison to good X, and the demand for good Y will increase and that of good X will fall.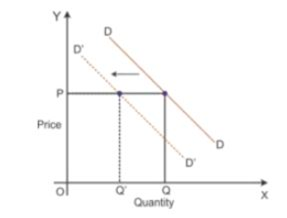
According to the diagram, DD is the initial demand curve for good X. At price OP, OQ quantity of good X is demanded. With a fall in the price of good Y, the demand for good X falls. Accordingly, the demand curve for good X shifts parallelly leftwards to D′D′. Here, even at the existing price OP, the quantity demand of good X falls to OQ′.
or,
Chain effects of excess supply of a good on its equilibrium price
Consider DD to be the initial demand curve and SS to be the supply curve of the market. Market equilibrium is achieved at Point E, where the demand and supply curves intersect each other. Therefore, the equilibrium price is OP, and the equilibrium quantity demanded is OQ. When there is change in other factors than price, there will be rise in the supply of goods. There will be a shift in the supply curve towards the right to SS1 with an increase in the supply, and the demand curve DD will remain the same. This implies that there will be a situation of excess supply at the equilibrium point.
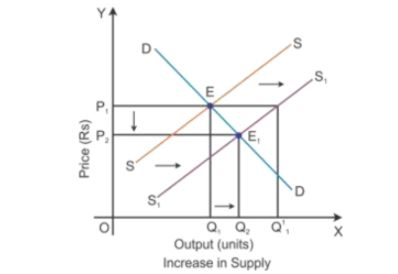
In the above diagram, there is an excess supply of OQ1 to OQ1
1 units of output at the initial price OP1. Thereby the producers will tend to reduce the price of the output to increase the sale in the market. Profit margin of the firm will come down and slowly some of the firms will tend to quit the market. Because of this, the market supply will decline to OQ2 level of output and the price of the output also gets reduce to the point OP2. Now, the new market equilibrium will be at Point E1, where the new supply curve SS1 intersects the demand curve DD.
Given below is the cost schedule of a product produced by a firm. The market price per unit of the product at all levels of output is Rs. 12. Using marginal cost and marginal revenue approach, find out the level of equilibrium output. Give reasons for your answer :
| output (units) | 1 | 2 | 3 | 4 | 5 | 6 |
| average cost (in RS) | 12 | 11 | 10 | 10 | 10.4 | 11 |
The ratio of total deposits that a commercial bank has to keep with Reserve Bank of India is called : (choose the correct alternative)
(a) Statutory liquidity ratio
(b) Deposit ratio
(c) Cash reserve ratio
(d) Legal reserve ratio
Aggregate demand can be increased by : (choose the correct alternative)
(a) increasing bank rate
(b) selling government securities by Reserve Bank of India
(c) increasing cash reserve ratio
(d) none of the above


 Switch


