
Figure 3.21 shows the x-t plot of one-dimensional motion of a particle. Is it correct to say from the graph that the particle moves in a straight line for t < 0 and on a parabolic path for t >0 ? If not, suggest a suitable physical context for this graph.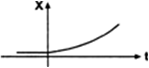
Position-time graph represents the position of particle at any instant, not the trajectory of particle.
For t < 0, the position-time graph is time axis which signifies that the particle is at rest.
For t > 0, the position-time graph is a parabola which signifies that the body starts moving with constant acceleration.
The given graph is a suitable context for a body is dropped from a certain height at t=0.
Given, 


 Switch


