'Analysis of age-pyramids for human population can provide important inputs for long-term planning strategies.' Explain.
Analysis of age pyramids for human population can provide important inputs for long-term planning strategies. The different age groups present in a population determine its reproductive status. Distribution of age groups highly influences the growth of the population. Each population displays following three ecological ages or age groups:
1. Pre-reproductive
2. Reproductive
3. Post-reproductive
Population having large number of young members grows rapidly, while, the population having more number of post-reproductive members tends to be declining. There are basically three types of age pyramids they are as follows: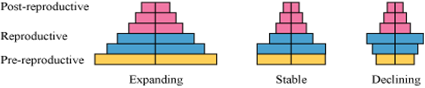
Therefore, through the thorough analysis of the age pyramids of a particular population, the distribution of resources can be done more efficiently. A better planning strategy can be adopted considering the demand of the resource; thus, long-term management of resources can be done in such a way that the population can derive maximum benefit with minimum effects on nature, leading the population to flourish efficiently.
(a) List the different attributes that a population has and not an individual organism.
(b) What is population density ? Explain any three different ways the population density can be measured, with the help of an example each.
(a) Following are the attributes that a population has but an individual organism does not have:
(b) Population density means number of individuals present per unit area. Population density can be measured by determining the population size. The different methods to study population size are as follows:
(1) Indirect method: In this method the population density is measured without actually counting or seeing the organism. For examples – the tiger consensus in our national park and tiger reserves are often based on the pug marks and fecal pellets of the tiger.
Example: The number of Parthenium plants in a given area can be measured using the quadrat method.
(2) Direct observation: It involves the counting of organisms in the given area.
Example: In order to determine the number of bacteria growing in a Petri dish, their colonies are counted.
(a) Name the two growth models that represent populations growth and draw the respective growth curves they represent.
(b) State the basis for the difference in the shape of these curves.
(c) Which one of the curves represent the human population growth at present ? Do you think such a curve is sustainable ? Give reason in support of your answer.
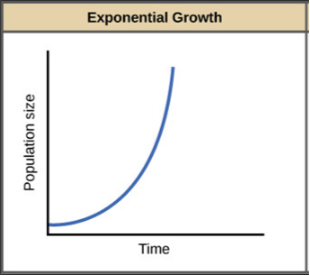
(a) Growth models
(1) Exponential growth - When the resources in the habitat are unlimited, each species has the ability to realise its innate potential t grow in number fully.
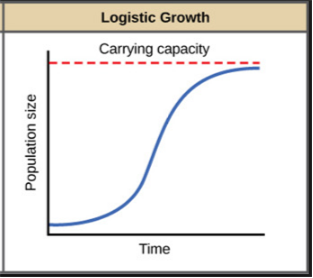
(2) Logistic growth - In nature, a given habitat has enough resources to support maximum possible number, beyond which no further growth is possible.
(b)
| Exponential growth | Logistic Growth |
| The graph is J-shaped. | The graph is Simoid shaped |
 |
 |
(a) Explain giving reasons why the tourists visiting Rohtang Pass or Mansarovar are advised to resume normal active life only after a few days of reaching there.
(b) It is impossible to find small animals in the polar regions. Give reasons.
(a) Tourists visiting high altitude areas such as Rohtang Pass or Mansarovar, experience altitude sickness. Its symptoms include nausea, fatigue and heart palpitations. This is because in the low atmospheric pressure of high altitudes, the body does not get enough oxygen. But, gradually we get acclimatised and stop experiencing altitude sickness. The body compensates low oxygen availability by increasing red blood cell production, decreasing the binding affinity of hemoglobin and by increasing breathing rate. Thus, the visitors are advised to resume their normal active life involving heavy works only after few days because for doing heavy tasks our body needs energy and this energy is obtained by the oxidation of glucose in the presence of oxygen which is a limiting factor in higher altitudes.
(b) Smaller animals are rarely found in Polar Regions because small animals have a larger surface area relative to their volume. Since heat loss or heat gain is a function of
surface area, they tend to lose body heat at a very fast rate when it is cold outside; because of which they have to expend much energy to generate body heat through metabolism.(a) Represent diagrammatically three kinds of age-pyramids for the human population.
(b) How does an age pyramid for human population at given point of time helps the policy makers in planning for the future.
(a) A population can be composed of individuals of different age groups. Age distribution plot for a given population is given by the age pyramid.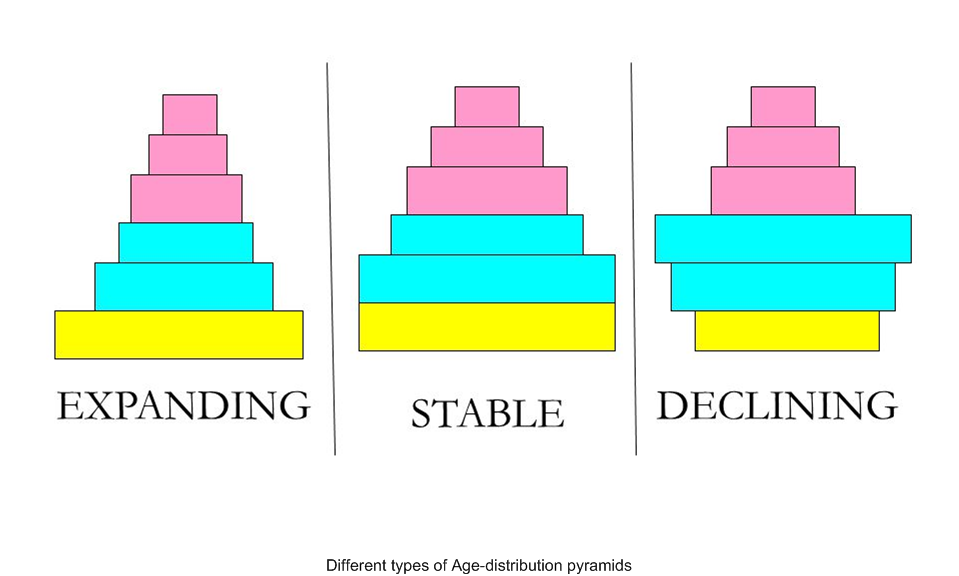
(b) The structure of the age pyramid determines the growth status of the population, that is, whether it is growing, stable or declining. On the basis of the collective information, the policies for the population can be decided. These may emphasis on providing food to the population, development of proper health services and much more.
For example, if the population is growing the policies can be made to increase the food resources to maintain the population.
If the population is declining then the policies can be made to keep a check on the mortality rate of the population.


 Switch


