|
30 |
39 |
58 |
17 |
34 |
50 |
23 |
37 |
|
42 |
49 |
55 |
59 |
19 |
28 |
47 |
49 |
|
18 |
60 |
56 |
36 |
58 |
35 |
55 |
37 |
|
25 |
34 |
39 |
61 |
53 |
33 |
36 |
53 |
|
61 |
62 |
39 |
53 |
21 |
18 |
28 |
23 |
The highest observation = 61.
The lowest observation = 17.
One of the class intervals = 40–48.
Class size = Upper class limit - Lower class limit = 48 – 40 = 8
∴ The appropriate classes can be:
16–24, 24–32, 32–40, 40–48, 48–56, 56–64
Thus, the frequency distribution table for the above data can be: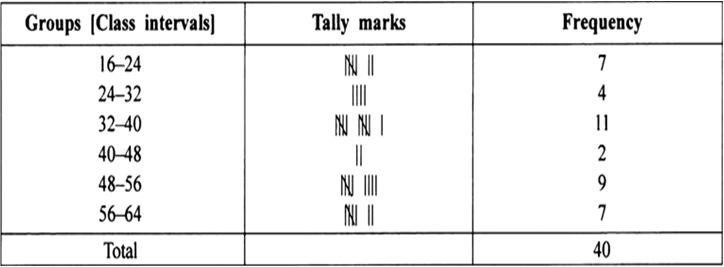
Detailed solution not provided.
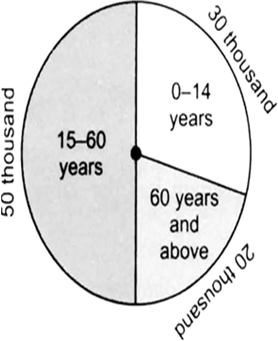
Ans. (i) 15-60 years
(ii) 30 thousand
(iii) 
Detailed solution not provided.
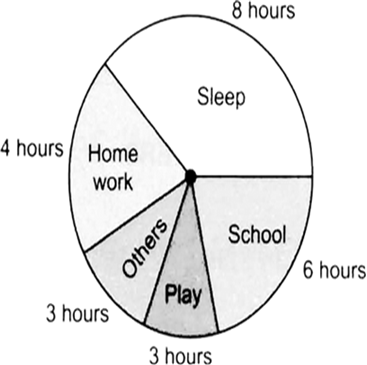
Ans. (i) Sleep
(ii) Play and others
(iii Sleep  , school
  , how work
 ![<pre>uncaught exception: <b>mkdir(): Permission denied (errno: 2) in /home/config_admin/public/felixventures.in/public/application/css/plugins/tiny_mce_wiris/integration/lib/com/wiris/util/sys/Store.class.php at line #56mkdir(): Permission denied</b><br /><br />in file: /home/config_admin/public/felixventures.in/public/application/css/plugins/tiny_mce_wiris/integration/lib/com/wiris/util/sys/Store.class.php line 56<br />#0 [internal function]: _hx_error_handler(2, 'mkdir(): Permis...', '/home/config_ad...', 56, Array)
#1 /home/config_admin/public/felixventures.in/public/application/css/plugins/tiny_mce_wiris/integration/lib/com/wiris/util/sys/Store.class.php(56): mkdir('/home/config_ad...', 493)
#2 /home/config_admin/public/felixventures.in/public/application/css/plugins/tiny_mce_wiris/integration/lib/com/wiris/plugin/impl/FolderTreeStorageAndCache.class.php(110): com_wiris_util_sys_Store->mkdirs()
#3 /home/config_admin/public/felixventures.in/public/application/css/plugins/tiny_mce_wiris/integration/lib/com/wiris/plugin/impl/RenderImpl.class.php(231): com_wiris_plugin_impl_FolderTreeStorageAndCache->codeDigest('mml=<math xmlns...')
#4 /home/config_admin/public/felixventures.in/public/application/css/plugins/tiny_mce_wiris/integration/lib/com/wiris/plugin/impl/TextServiceImpl.class.php(59): com_wiris_plugin_impl_RenderImpl->computeDigest(NULL, Array)
#5 /home/config_admin/public/felixventures.in/public/application/css/plugins/tiny_mce_wiris/integration/service.php(19): com_wiris_plugin_impl_TextServiceImpl->service('mathml2accessib...', Array)
#6 {main}</pre>](/application/zrc/images/qvar/MAEN8036090-3.png) ; play
; play  , others
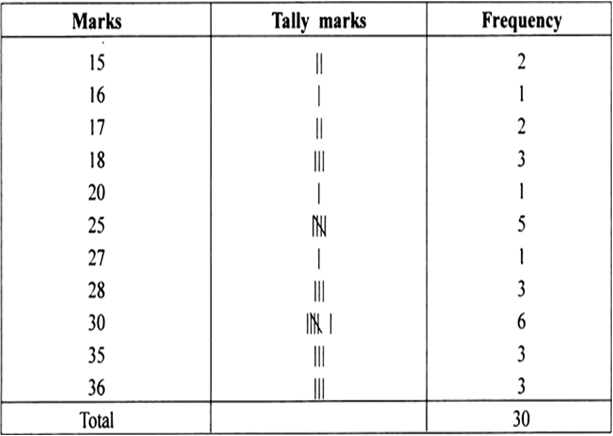
Following are the marks scored by 30 students in a test out of 40 marks. Using tally marks prepare a frequency table:
|
30 |
18 |
27 |
15 |
25 |
28 |
15 |
30 |
|
35 |
36 |
25 |
30 |
20 |
28 |
17 |
30 |
|
36 |
35 |
35 |
18 |
30 |
17 |
30 |
|
|
25 |
36 |
28 |
25 |
25 |
18 |
16 |


 Switch


