
The following graph shows the temperature of a patient in a hospital, recorded every hour.
(a) What was the patient’s temperature at 1 p.m.?
(b) When was the patient’s temperature 38.5° C?
(c) The patient’s temperature was the same two times during the period given. What were these two times?
(d) What was the temperature at 1.30 p.m.? How did you arrive at your answer?
(e) During which periods did the patients’ temperature showed an upward trend?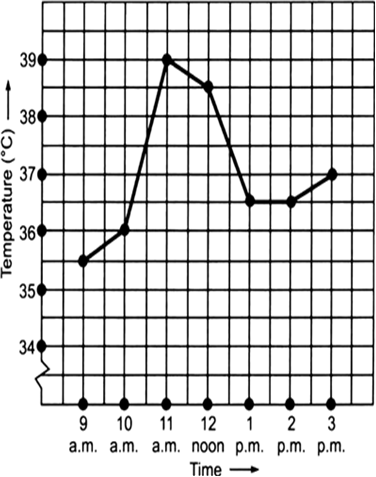
(a) The patient’s temperature at 1 p.m. was 36.5°.
(b) The patient's temperature 38.5° C was at 12 noon.
(c) The patient's temperature was same at 1 p.m. and 2 p.m.
(d) The patient’s temperature at 1:30 p.m. was 36.5° C [because the temperature of the patient was constant (i.e. 36.5° C) from 1 p.m. to 2 p.m.].
(e) The temperature of patient showed an upward trend during 9 a.m to 10 a.m. to 11 a.m. and 2 p.m. to 3 p.m.
The following line graph shows the yearly sales figures for a manufacturing company.
(a) What were the sales in (i) 2002 and (ii) 2006?
(b) What were the sales in (i) 2003 and (ii) 2005?
(c) Compute the difference between the sales in 2002 and 2006.
(d) In which year was there the greatest difference between the sales as compared to its previous year?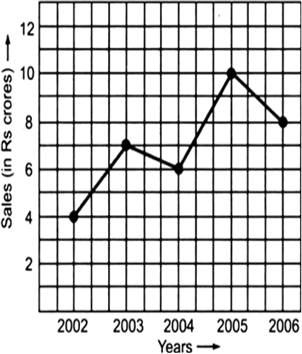
(a) (i) Company's sale in 2002 was Rs 4 crores.
(ii) Company’s sale in 2006 was Rs 8 crores.
(b) (i) Company’s sale in 2003 was Rs 7 crores.
(ii) Company’s sale in 2005 was Rs 10 crores.
(c) Difference between the sales in 2002 and 2006 = [Rs 8 crores] – [Rs 4 crores]
= Rs 4 crores
(d) The greatest difference between the sales of two consecutive years 2004 and 2005.

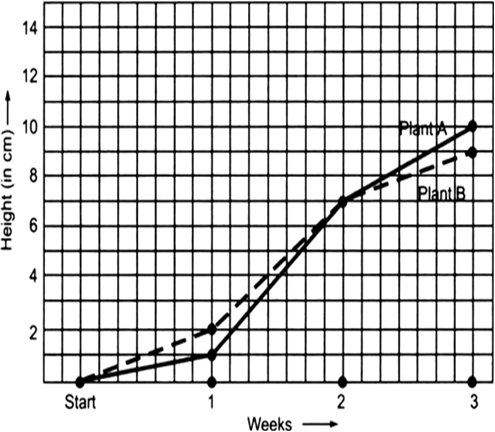
(a) How high was plant A after (i) 2 weeks and (ii) 3 weeks?
(b) How high was plant B after (i) 2 weeks and (ii) 3 weeks?
(c) How much did plant A grow during the 3rd week?
(d) How much did plant B grow from the end of the 2nd week to the end of the 3rd week?
(e) During which week did plant A grow most?
(f) During which week did plant B grow least?
(g) Were the two plants of the same height during any week shown here? Specify.
(a) (i) After 2 weeks: The plant A was 7 cm high. (ii) After 3 weeks:The plant A was 9 cm high.
(b) (i) After 2 weeks: The plant B was 7 cm high. (ii) After 3 weeks: The plant B was 10 cm high.
(c) During the 3rd week, the plant grew (9 cm – 7 cm), i.e. 2 cm.
(d) The plant B grew 10 cm – 7 cm = 3 cm from the end of 2nd week to the end of the 3rd week.
(e) The growth of the plant A:
During the 1st week = 1 cm – 0 cm = 1 cm, During the 2nd week = 7 cm – 1 cm = 6 cm, During the 3rd week = 9 cm – 7 cm = 2 cm. Thus, during the 2nd week, the plant A grew the must.
(f) The growth of the plant B during:
the 1st week = 1 cm – 0 cm = 1 cm
the 2nd week = 7 cm – 1 cm = 6 cm
the 3rd week = 10 cm – 7 cm = 3 cm
Thus, the plant-B grew the least in the first week.
(g) Both the plants have shown almost the same height at the end of the 2nd week.
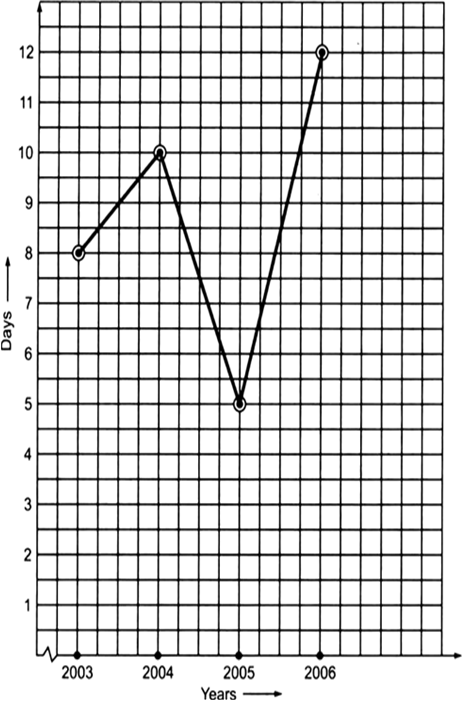
The following graph shows the temperature forecast and the actual temperature for each day of a week.
(a) On which days was the forecast temperature the same as the actual temperature?
(b) What was the maximum forecast temperature during the week?
(c) What was the minimum actual temperature during the week?
(d) On which day did the actual temperature differ the most from the forecast temperature?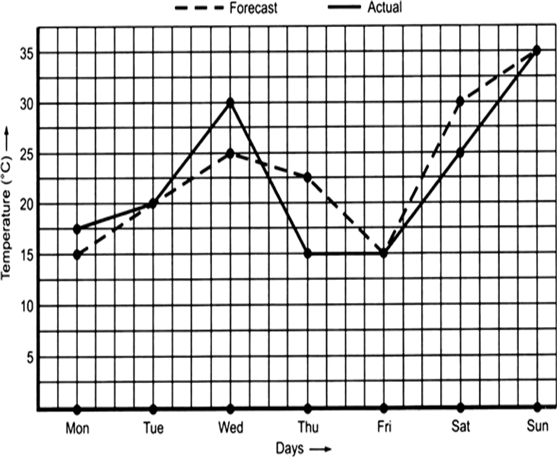
(a) The forecast temperature was the same as the actual temperature on Tuesday, Friday and Sunday.
(b) The maximum forecast temperature during the week was 35° C.
(c) The maximum actual temperature during the week was 15° C.
(d) Difference between the actual temperature and the forecast temperature on
Monday = 17.5° C – 15° C = 2.5° C
Tuesday = 20.5° C – 20° C = 0.5° C
Wednesday = 30.0° C – 25° C = 5° C
Thursday = 22.5° C – 15° C = 7.5° C
Friday = 15° C – 15° C = 0° C
Saturday = 30° C – 25° C = 5° C
Sunday = 35° C – 35° C = 0° C
Thus, the maximum difference was on Tuesday.


 Switch


