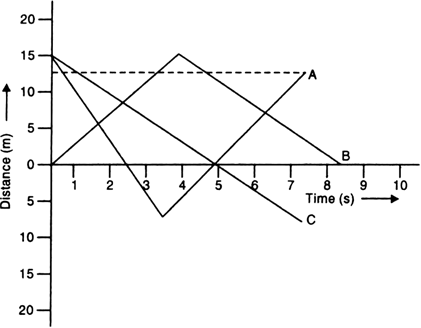
(i) In graph A,
Total distance travelled = 15 + 7.5 + 7.5 + 12.5
= 42.5 m
Graph B,
Total distance travelled = 15 + 15 = 30 m
Graph C,
Total distance travelled in graph C = 15 + 7.5 = 22.5 m.
(ii) Displacement is the shortest distance between the initial and final positions.
∴ Displacement in graph A = 12.5 – 15 = – 2.5 m.
Displacement in graph B = 0 – 0 = 0m. [ Because the object is returning back to the initial point]
Displacement in graph C = – 7.5 - 15 = – 22.5 m.
(iii) In graph B,
Before t = 4 s, the velocity is positive and after t = 4 sec, velocity is negative.
So the acceleration is negative at t = 4 s in graph B.
Draw a velocity-time graph for a body in uniform acceleration. Hence, show that the area under the velocity-time graph gives the distance travelled by the body in the given time interval.
Distance covered as area under the velocity-time graph. Fig. 8.14 shows the velocity-time graph for a body in uniform acceleration. It is a straight line inclined to the time-axis. The body has velocities u and v at times t1
and t2 respectively. 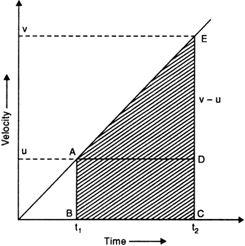
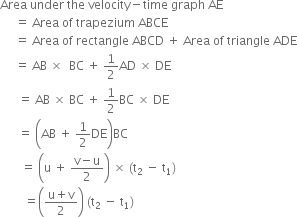
Hence, the area under the velocity-time graph gives the distance travelled by the body in the given time interval.
Plot distance-time graphs of bodies moving with uniform speeds of 4 m/s and 7 m/s. Compare the graphs.
For a body moving with a uniform speed of 4 m/s 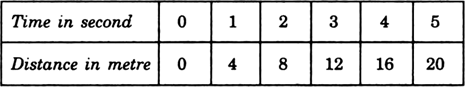
For a body moving with a uniform speed of 7 m/s
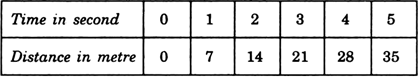
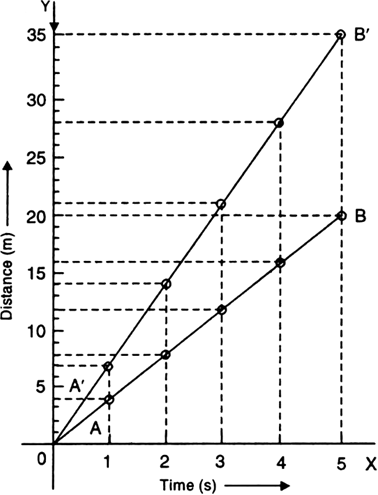
For the body moving with a uniform speed of 4 m/s, the distance-time graph is the straight line AB . For the body moving with a uniform speed of 7 m/s, the distance-time graph is the straight line A'B'. Clearly, slope of graph A'B' is more than that of graph AB.
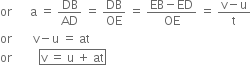
Derive the equations of motion for uniformly accelerated motion from velocity-time graph.
Equations of motion by graphical method. Consider an object moving along a straight line with initial velocity u and uniform acceleration a. Suppose, it travels distance s in time t. As shown in Fig. 8.19, its velocity-time graph is straight line. Here OA = ED = u, OC = EB = v and OE = t = AD.
1. Equation for velocity-time relation. We know that Acceleration = Slope of velocity-time graph AB
This proves the first equation of motion.
2. Equation for position-time relation.
From the above part, we have
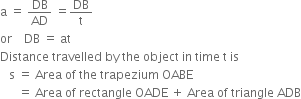
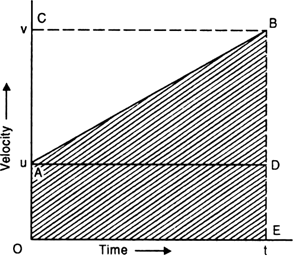
Fig. 8.19.
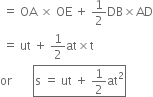
3. Equation for position-velocity relation. The distance travelled by object in time t is
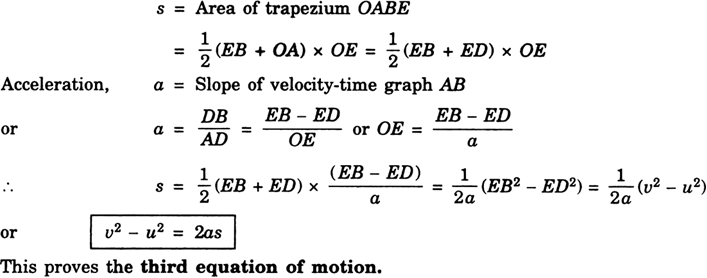
What types of motions are represented by the following velocity-time graphs? 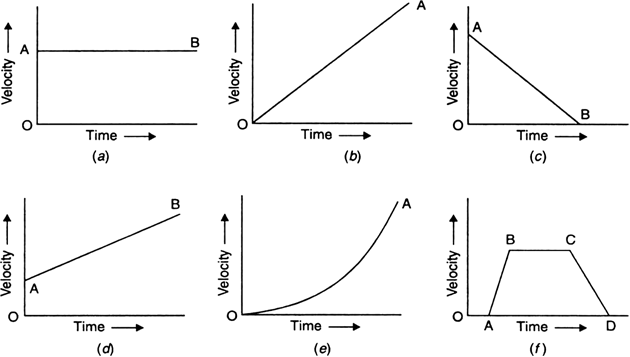
(a) Since the velocity-time graph is a straight line, the body has uniform velocity.
(b) The body has uniform acceleration and its initial velocity is zero because the lne starts from the origin.
(c) The body has some initial velocity and is under uniform retardation.
(d) The body has some initial velocity and uniform acceleration.
(e) The body has zero initial velocity and it has variable acceleration.
(f) The body is at rest from O to A, it has uniform acceleration from A to B, it has uniform velocity from B to C and from C to D, the body is under uniform retardation.


 Switch


