 Multiple Choice Questions
A line graph
makes comparisons
show trend over time
compares structures
compares structures
The heights of two similar right angled triangles  and
and  are 48cm and 36 cm. If OP = 12 cm, then LM is
16 cm
20 cm
12 cm
12 cm
In the given figures, the lengths of the sides of  and
and  are given and they are given in same units. Also,
  and
and  are given. The value of
  is
is 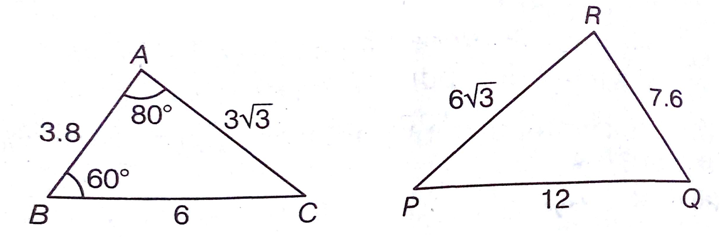


In the given figure, POQ is a diameter and PQRS is a cyclic quadrilateral. If  , then the value of
  is
is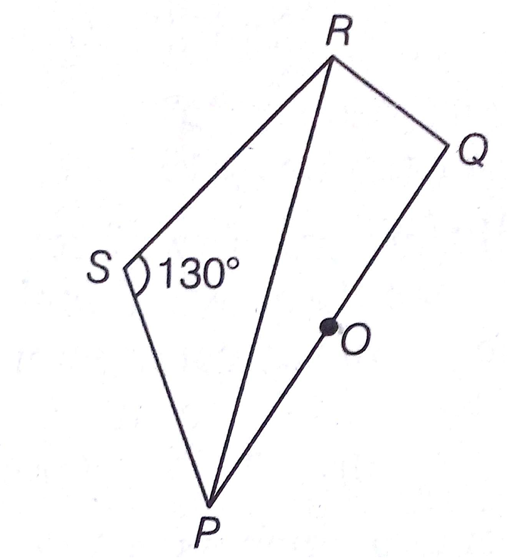


Study the following graph and answer the questions. 
From 1991 to 1992, what was the approximate percentage reduction in import of crude oil?
22
18
8
8
Study the following graph and answer the questions. 
In how many years were the imports higher than the average value of imports?
1
2
3
3
Study the following graph and answer the questions. 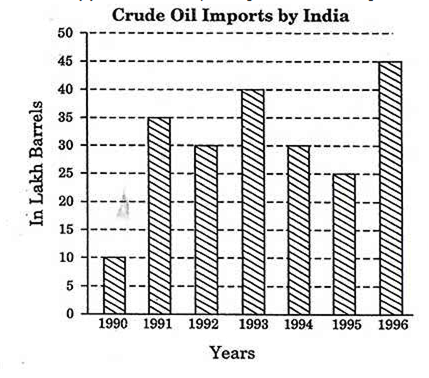
If the rate of one barrel of crude oil was ₹ 25.60 in 1995, then what was the total value of imports (in ₹) in that year?
64 crore
64 lakh
6.4 crore
6.4 crore
Study the following graph and answer the questions. 
From year 1995 to the year 1996, what was the percentage increase in imports of crude oil?
180
60
90
90


 Switch


