 Multiple Choice Questions
The radius and the height of a cone are each increased by 20%. Then the volume of the cone increases by
20%
20.5%
62%
62%
D.
62%
Volume of cone
As radius is (r)2
Percentage increase in radius:

Height is h which is 20% increase
Now,
Net percentage change in volume of cone
A bar graph showing the heights of six mountain peaks. Study the bar graph and answer the questions.
The average height of all the peaks (in m) is
7601.5
7600
7599.5
7599.5
A bar graph showing the heights of six mountain peaks. Study the bar graph and answer the questions.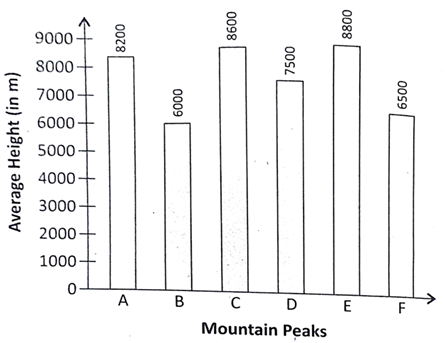
Which peak is the second highest?
B
C
A
A
A bar graph showing the heights of six mountain peaks. Study the bar graph and answer the questions.
Write the ratio of the heights of the highest peak and the lowest peak.
22 : 15
15 : 22
20 : 13
20 : 13
A bar graph showing the heights of six mountain peaks. Study the bar graph and answer the questions.
When the heights of the given peaks are written in ascending order, what is the average of the middle two peaks?
7950 m
7560 m
7650 m
7650 m


 Switch


