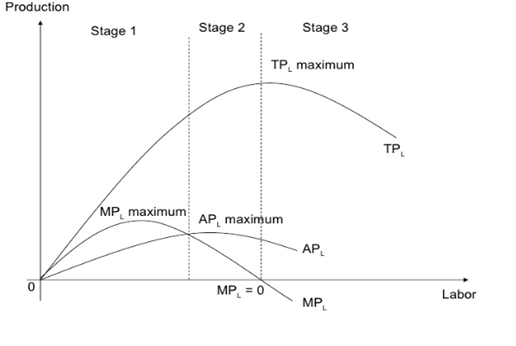
Shapes Of Total Product, Marginal Product And Average Product Curves
Shapes of Total Product, Marginal Product, And Average Product Curves (In short run) can be better understood by the following relationship between them.
Relationship between TP, AP and MP:
- When TP rises at increasing rate, Both MP and AP also rises but MP > AP.
- When TP is maximum, MP is zero.
- When TP rises at diminishing rate, both AP and MP decline but MP < AP.
- When TP declines, AP also declines and MP becomes negative (-).
- MP can be zero and negative but AP is never zero.

From the figure,
- In stage 1, TP is increasing at an increasing rate leading to both AP and MP increase.
- In Stage 2, TP is increasing at a diminishing rate leading to both AP and MP fall.
- In Stage 3, TP starts declining leading to decline in AP and MP becomes negative.