Advertisement

Figure 13.10 shows the effect of light on the rate of photosynthesis. Based on the graph, answer the following questions:

(a) At which point/s (A, B or C) in the curve is light a limiting factor?

(b) What could be the limiting factor/s in region A?

(c) What do C and D represent on the curve?


Figure 13.10 shows the effect of light on the rate of photosynthesis. Based on the graph, answer the following questions:
(a) At which point/s (A, B or C) in the curve is light a limiting factor?
(b) What could be the limiting factor/s in region A?
(c) What do C and D represent on the curve?

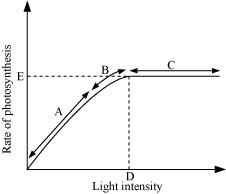
(a)  Since the rate of photosynthesis doe not increase with the increase in the incident light therefore light is a limiting factor in the region B.

(b) The other limiting factors may be water, temperature, and the concentration of carbon dioxide.

(c) Point D represents the optimum point and gives the light intensity at which the maximum photosynthesis is recorded.
Ponit c represents the region where the rate of photosynthesis remains constant even after incresing the incident light. 

506 Views

Advertisement
Why is the colour of a leaf kept in the dark frequently yellow, or pale green? Which pigment do you think is more stable?

Suppose there were plants that had a high concentration of Chlorophyll-b, but lacked chlorophyll-a, would it carry out photosynthesis? Then why do plants have chlorophyll-and other accessory pigments?

Give comparison between C3 and C4 pathways.


Look at leaves of the same plant on the shady side and compare it with the leaves on the sunny side. Or, compare the potted plants kept in the sunlight with those in the shade. Which of them has leaves that are darker green? Why?

First 1 2 Last
Advertisement