Advertisement
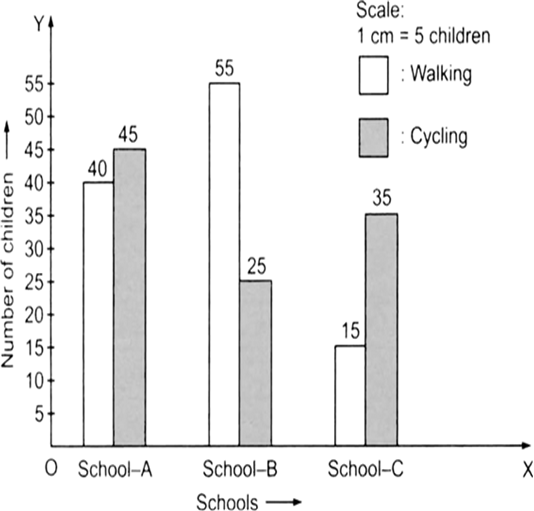
Draw an appropriate graph to represent the given information.

Since, a comparison of two activities (walking and cycling) is to be represented, therefore a double-graph is drawn by taking the schools along x-axis and number of children along y-axis, using a scale of 1 cm = 5 children.
1200 Views
Advertisement
Study the following frequency distribution table and answer the questions given below.
Frequency distribution of daily income of 550 workers of a factory
Frequency distribution of daily income of 550 workers of a factory
(i) What is the size of the class intervals?
(ii) Which class has the highest frequency?
(iii) Which class has the lowest frequency?
(iv) What is the upper limit of the class interval 250-275?
(v) Which two classes have the same frequency?
Draw an appropriate graph to represent the given information.
A group of students were asked to say which animal they would like most to have as a pet. The results are given below:
dog, cat, cat, fish, cat, rabbit, dog, cat, rabbit, dog, cat, dog, dog, dog, cat, cow, fish, rabbit, dog, cat, dog, cat, cat, dog, rabbit, cat, fish, dog.
Make a frequency distribution table for the same.
dog, cat, cat, fish, cat, rabbit, dog, cat, rabbit, dog, cat, dog, dog, dog, cat, cow, fish, rabbit, dog, cat, dog, cat, cat, dog, rabbit, cat, fish, dog.
Make a frequency distribution table for the same.
Draw an appropriate graph to represent the given information.
Percentage wins in ODI by 8 top cricket teams.
Percentage wins in ODI by 8 top cricket teams.
Advertisement