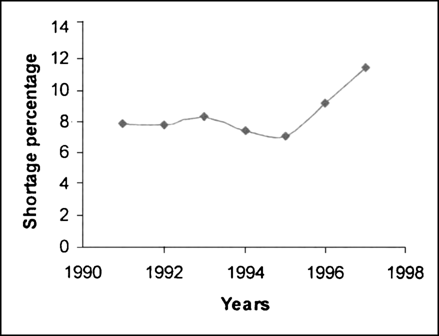
The following Table shows the total power shortage in India from 1991-1997. Show the data in the form of a graph. Plot shortage percentage for the year on the Y-axis and the year on the X-axis.
|
1 |
Year 1991 |
Shortage % 7.9 |
|
2 |
1992 |
7.8 |
|
3 |
1993 |
8.3 |
|
. 4 |
1994 |
7.4 |
|
5 |
1995 |
7.1 |
|
6 |
1996 |
9.2 |
|
7 |
1997 |
11.5 |

Describe characteristics and uses of coke.
Explain why fossil fuels are exhaustible natural resources?
Explain the process of formation of petroleum.
Kerosene is not a fossil fuel.