
The distance (in km) of 40 engineers from their residence to their place of work were found as follows:
5 3 10 20 25 11 13 7 12 31
19 10 12 17 18 11 32 17 16 2
7 9 7 8 3 5 12 15 18 3
12 14 2 9 6 15 15 7 6 12
Construct a grouped frequency distribution table with class size 5 for the data given above, taking the first interval as 0–5 (5 not included). What main features do you observe from this tabular representation ?
(i)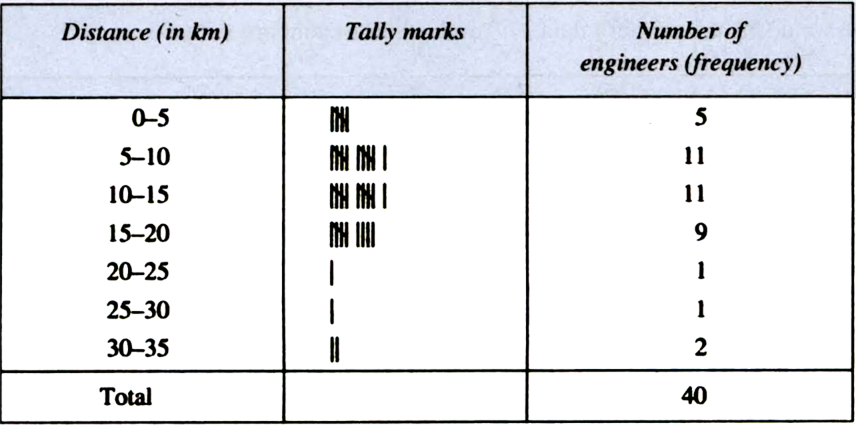
We observe the following main features from this tabular representation:
(i) The distances (in km) from their residence to their work place of the maximum number of engineers are in the third interval, i.e., 10–15.
(ii) The distances (in km) from their residence to their work place of the minimum number of engineers are in the intervals 20–25 and 25–30 each.
(iii) The frequencies of the intervals 20–25 and 25–30 are the same. (Each = 1)
(i) Number of students in our class,
(ii) Number of fans in our school.
(iii) Electricity bills of our house for last two years.
(iv) Election results obtained from television or newspaper.
(v) Literacy rate figures obtained from
The relative humidity (in %) of a certain city for a month of 30 days is as follows:
98.1 98.6 99.2 90.3 86.5 95.3 92.9 96.3 94.2 95.1
89.2 92.3 97.1 93.5 92.7 95.1 97.2 93.3 95.2 97.3
96.2 92.1 84.9 90.2 95.7 98.3 97.3 96.1 92.1 89
(i) Construct a grouped frequency distribution table with classes 84-86, 86-88, etc.
(ii) Which month or season do you think this data is about?
(iii) What is the range of this data?
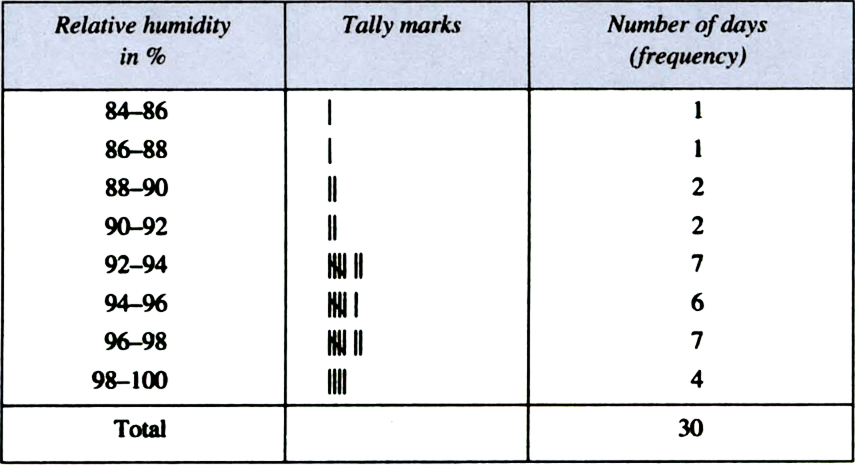
(ii) This data appears to be taken in the rainy reason as the relative humidity is high.
(iii) Range = Highest value – Lowest value = 99.2 – 84.9= 14.3 (in %).
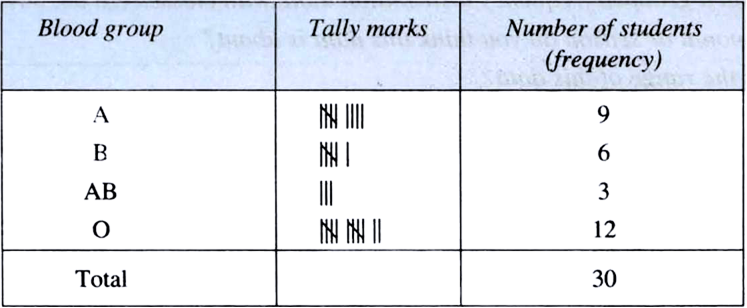
The blood groups of 30 students of Class VIII are recorded as follows:
A,B,O,O,AB,O,A O,B,A,O,B, A,O,O,
A,AB,O,A,A,O,O,AB,B,A,O,B,A,B.O.
Represent this data in the form of a frequency distribution table. Which is the most common and which is the rarest, blood group among these students.


 Switch


