 Short Answer Type
The following graph shows the species – area relationship. Answer the following questions as directed
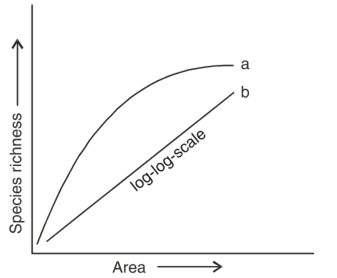
(a) Name the naturalist who studied the kind of relationship shown in the graph. Write the observations made by him.
(b) Write the situations as discovered by the ecologists when the value of ‘Z’ (slope of the line) lies between (i) 0.1 and 0.2 (ii) 0.6 and 1.2 What does ‘Z’ stand for ?
(c) When would the slope of the line ‘b’ become steeper ?
(a) List any three ways of measuring population density of a habitat.
(b) Mention the essential information that can be obtained by studying the population of an organism. Long Answer Type
(a) Explain giving reasons why the tourists visiting Rohtang Pass or Mansarovar are advised to resume normal active life only after a few days of reaching there.
(b) It is impossible to find small animals in the polar regions. Give reasons.
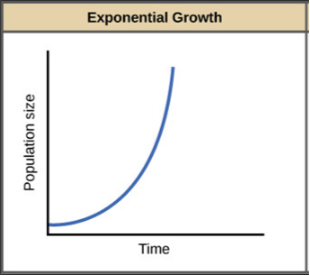
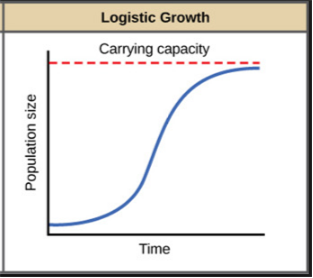
Short Answer TypeLong Answer Type(a) Name the two growth models that represent populations growth and draw the respective growth curves they represent.
(b) State the basis for the difference in the shape of these curves.
(c) Which one of the curves represent the human population growth at present ? Do you think such a curve is sustainable ? Give reason in support of your answer.
(a) Growth models
(1) Exponential growth - When the resources in the habitat are unlimited, each species has the ability to realise its innate potential t grow in number fully.
(2) Logistic growth - In nature, a given habitat has enough resources to support maximum possible number, beyond which no further growth is possible.
(b)
| Exponential growth | Logistic Growth |
| The graph is J-shaped. | The graph is Simoid shaped |
 |
 |
Short Answer TypeDuring a school trip to 'Rohtang pass' one of your classmate suddenly developed 'Altitude sickness'. But, she recovered after sometime.
(a) Mention one symptom to diagnose the sickness.
(b) What causes the sickness?
(c) How could she recover by herself after sometime?
Long Answer Type(a) Represent diagrammatically three kinds of age-pyramids for the human population.
(b) How does an age pyramid for human population at given point of time helps the policy makers in planning for the future.
Short Answer TypeWater is very essential for life. Write any three features both for plants and animals which enable them to survive in water scarce environment.
How do organisms cope with stressful external environmental conditions which are localised or of short duration?


 Switch


