 Short Answer Type
Give a scientific term :
Maximum number of individuals that an environment can support.
(a) Organisms may be conformers or regulators. Explain this statement and give one example of each.
(b) Why are there more conformers than regulators in the animal world ?
Describe the inter-relationship between productivity, gross primary productivity and net productivity.
 Long Answer Type
(a) Compare, giving reasons, the J-shaped and S-shaped models of population growth of a species.
(b) Explain ‘fitness of a species’’ as mentioned by Darwin.
(a) There are 2 models of population growth : (i) The exponential growth (ii) Logistic growth (i) Exponential growth : This growth occurs where the resources (food + space) are unlimited. The equation can be represented as dt dN = (b – d) × N Let (b – d) = r rN dt dN = or rt t 0 N = N e N = population size Nt = population density after time t. N0 = population density at time zero r = growth rate b = birth rate d = death rate In this growth, when N in relation to time is plotted on graph, the curve becomes J-shaped.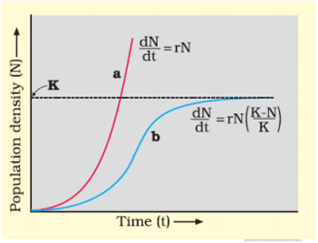
(a) J-shaped curve ⇒ exponential growth
(b) S-shaped curve ⇒ logistics growth
Every ecosystem has limited resources to support a particular maximum carrying capacity (K). When N is plotted in relation to time t, a sigmoid-S-shaped curve is obtained & is also called as VERHULST-PEARL logistic growth. The equation is : dt dN = rN K (K − N) N = population density at time t. r = growth rate K = carrying capacity.
Short Answer TypeFollowing are the responses of different animals to various abiotic factors. Describe each one with the help of an example.
(i) Regulate
(ii) Conform
(iii) Migrate
(iv) Suspend
If 8 individuals in a population of 80 butterflies die in a week, calculate the death rate of population of butteflies during that period.
 Multiple Choice Questions
In biotic community, which of the following can be called protective device ?
Mimicry
Symbiosis
Competition
Parasitism
It is much easier for a small animal to run uphill than a large animal, because
smaller animals have a higher metabolic rate
small animals have a lower O2 requirement
the efficiency of muscles in large animals in less than in the small animals
the efficiency of muscles in large animals in less than in the small animals


 Switch


