 Multiple Choice Questions
The pie chart provided below gives the distribution of land (in a village) under various food crops. Study the pie-chart carefully and answer the questions from 91 to 95.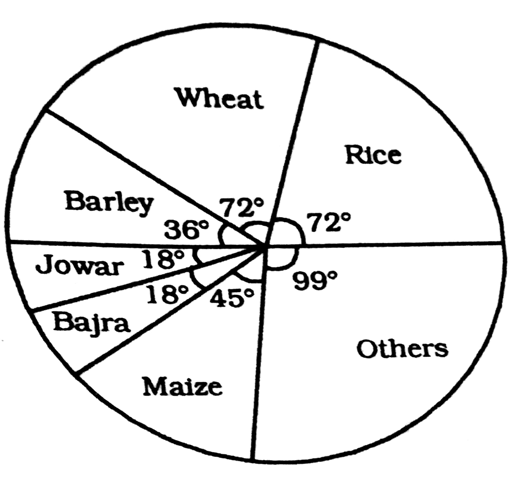
If 10% of the land reserved for rice be distributed to wheat and barley in the ratio 2 : 1, then the angle corresponding to wheat in the new pie-chart will be
38.4°
76.8°
75.6°
75.6°
The pie chart provided below gives the distribution of land (in a village) under various food crops. Study the pie-chart carefully and answer the questions from 91 to 95.
If the production of rice is 5 times that of jowar and the production of jowar is 2 times that of bajra, then the ratio between the yield per acre of rice and bajra is
5 :2
3 : 1
4 : 1
4 : 1
The pie chart given below, shows the expenditure on various items and savings of a family during the year 2009. Study the pie chart and answer these questions
PERCENTAGE OF MONEY SPENT ON VARIOUS ITEMS AND SAVINGS BY A FAMILY DURING 2009
If the total income of the family for the year 2009 was Rs. 1,50,000 then the difference between the expenditures on housing and transport was
Rs. 15,000
Rs. 10,000
Rs. 12,000
Rs. 12,000
The pie chart given below, shows the expenditure on various items and savings of a family during the year 2009. Study the pie chart and answer these questions
PERCENTAGE OF MONEY SPENT ON VARIOUS ITEMS AND SAVINGS BY A FAMILY DURING 2009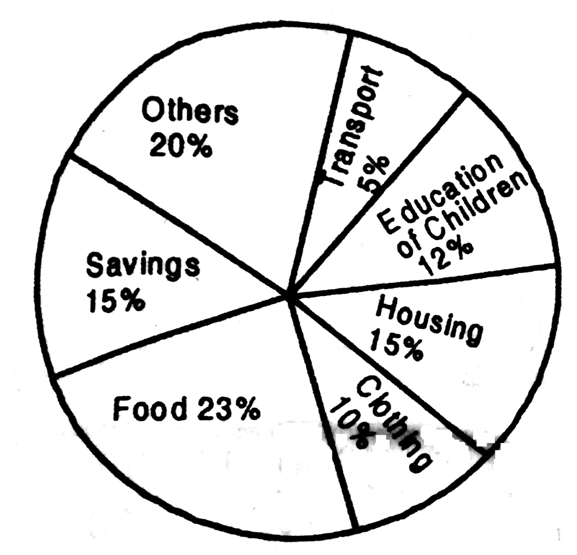
Maximum expenditure of the family other than on food, was on
Housing
Clothing
Others
Others
The pie chart given below, shows the expenditure on various items and savings of a family during the year 2009. Study the pie chart and answer these questions
PERCENTAGE OF MONEY SPENT ON VARIOUS ITEMS AND SAVINGS BY A FAMILY DURING 2009
The savings of the family for the year were equal to the expenditure on
Food
Housing
Education of children
Education of children
The pie chart given below, shows the expenditure on various items and savings of a family during the year 2009. Study the pie chart and answer these questions
PERCENTAGE OF MONEY SPENT ON VARIOUS ITEMS AND SAVINGS BY A FAMILY DURING 2009
The percentage of the income which was spent on clothing, education of children and transport together is
17
20
22
22
The pie chart given below, shows the expenditure on various items and savings of a family during the year 2009. Study the pie chart and answer these questions
PERCENTAGE OF MONEY SPENT ON VARIOUS ITEMS AND SAVINGS BY A FAMILY DURING 2009
If the total income of the family was Rs. 1,50,000 then the money spent on food was
Rs. 20,000
Rs. 23,000
Rs. 30,000
Rs. 30,000
The following pie-chart shows the monthly expenditure of a family on various items. If the family spends Rs. 825 on clothing, answer the questions.
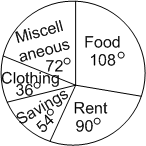
What is the total monthly income of the family?
Rs. 8025
Rs. 8250
Rs. 8520
Rs. 8520
The following pie-chart shows the monthly expenditure of a family on various items. If the family spends Rs. 825 on clothing, answer the questions.

What per cent of the total income does the family save?
15%
50%
20%
20%
The following pie-chart shows the monthly expenditure of a family on various items. If the family spends Rs. 825 on clothing, answer the questions.

What is the ratio of expenses on food and miscellaneous?
3 : 4
2 : 3
3 : 2
3 : 2


