 Multiple Choice Questions
The pie chart drawn below shows the spendings of a country on various sports during a particular year. Study the pie-chart and answer the questions.
Total central angle showing the money spent on hockey, football and other during the yer was:
104°
244°
96°
144°
The pie chart drawn below shows the spendings of a country on various sports during a particular year. Study the pie-chart and answer the questions.
If the money spent on cricket during the year was Rs 20,00,000/-, then the money spent on tennis was
Rs 8,00,000
Rs 10,00,000
Rs 80,00,000
Rs 40,00,000
The pie chart, given here represents the number of valid votes obtained by four students who contested election for school leadership. The total number of valid votes polled was 720.
Observed the chart and answer the question followed it.
What was the minimum number of votes obtained by any candidate?
100
110
120
130
The pie chart, given here represents the number of valid votes obtained by four students who contested election for school leadership. The total number of valid votes polled was 720.
Observed the chart and answer the question followed it.

Sivaraman
Paramjeet
Yasin
Vishwanath
The pie chart, given here represents the number of valid votes obtained by four students who contested election for school leadership. The total number of valid votes polled was 720.
Observed the chart and answer the question followed it.
By how many votes did the winner defeat his nearest rival?
40
45
48
50
Read the given information carefully and the questions given below.
Population of five adjacent areas of a town, in the year of 2010, are represented in the following pie-chart. The ratio of the numbers of males to that of females in these areas are stated in the table below. The total population in all the five years is 72 lakh.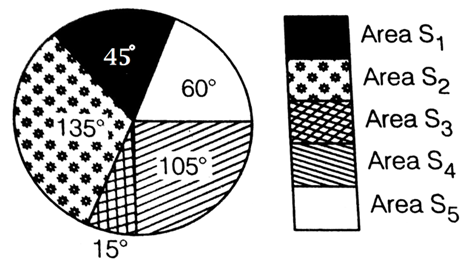
Ratio of numbers of males (M) to females (F)
12 lakh is the population of the area
S1
S3
S5
S4
Read the given information carefully and the questions given below.
Population of five adjacent areas of a town, in the year of 2010, are represented in the following pie-chart. The ratio of the numbers of males to that of females in these areas are stated in the table below. The total population in all the five years is 72 lakh.
The number of males in the areas S1 and S4 together is
13.8 lakh
8.2 lakh
16.2 lakh
15.8 lakh
Read the given information carefully and the questions given below.
Population of five adjacent areas of a town, in the year of 2010, are represented in the following pie-chart. The ratio of the numbers of males to that of females in these areas are stated in the table below. The total population in all the five years is 72 lakh.
The ratio of number of females in the area S2 to that in the area S5 is
7 : 9
36 : 13
9 : 7
13 : 36
Read the given information carefully and the questions given below.
Population of five adjacent areas of a town, in the year of 2010, are represented in the following pie-chart. The ratio of the numbers of males to that of females in these areas are stated in the table below. The total population in all the five years is 72 lakh.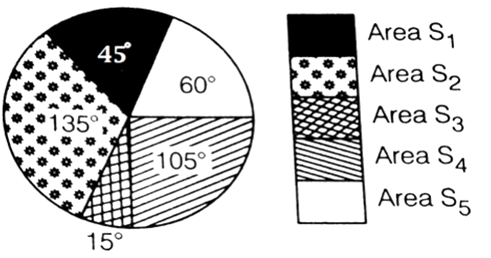
If in the year 2010, there was an increase of 5% population in the area S1 and 8% increase in population of the area S3 compared to the previous year, then the ratio of population in the areas S1 and S3 in the year 2009 was
108 : 35
27 : 10
27 : 70
10 : 3
Read the given information carefully and the questions given below.
Population of five adjacent areas of a town, in the year of 2010, are represented in the following pie-chart. The ratio of the numbers of males to that of females in these areas are stated in the table below. The total population in all the five years is 72 lakh.
The average of females population in all the five areas is lower than the female population in each of the areas
S1 and S2
S2 and S5
S2 and S4
S4 and S5


