 Multiple Choice Questions
Refer the below data table and answer following question:
| Year | Profit or (-Loss) in ₹ crore |
| 2011 | 5 |
| 2012 | -5 |
| 2013 | 20 |
| 2014 | 5 |
| 2015 | -5 |
What was the total profit or loss of the company in last 5 years?
Profit of ₹ 30 crore
Loss of ₹ 20 crore
Loss of ₹ 30 crore
Profit of ₹ 20 crore
Refer the below data table and answer following question:
| India's exports in 2015 | Value in million US dollar |
| Jewellery | 500 |
| Software | 850 |
| Cotton | 950 |
| Steel | 875 |
| Electronics | 1000 |
Electronics was what percent of total exports?
23.46 %
25.96 %
18.46 %
20. 96 %
Refer the below of data table and answer the following question.
| Employee | Number of employees | Annual Salary (in ₹ lakh) | Bonus as percent of annual salary |
| Manager | 1 | 48 | 40% |
| Executive | 6 | 16 | 20% |
| Trainee | 2 | 2 | 20% |
What is the average bonus (in ₹)?
3920004
220000
228000
435556
Refer the below data table and answer following question.
| Company | 2011 | 2012 | 2013 | 2014 | 2015 |
| Company A | 4000 | 3000 | 3000 | 1000 | 2000 |
| Company B | 1000 | 1000 | 1000 | 5000 | 4000 |
| Company C | 1000 | 1000 | 4000 | 2000 | 1000 |
For which of the following pairs of years the total exports from the three companies together are equal?
(Note: Figures given are in ₹ lakh)
2013 and 2014
2013 and 2015
2011 and 2012
2014 and 2015
The following table shows the number of students of 7 colleges participating in extra curricular activities:
Read the table and answer questions 86 to 90.
The difference of the range of number of students in activity IV and the average of number of students in activity III per college is
111
153
104
104
C.
104
Range of number of students in activity IV
= 438 - 105 = 333
Average number of students in activity III: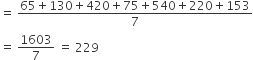
∴ Required difference = 333 - 229 = 104
The following table shows the number of students of 7 colleges participating in extra curricular activities: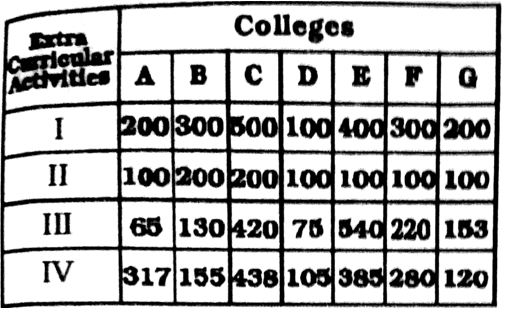
Read the table and answer questions 86 to 90.
Percentage of the number of students in activity II to that of IV is
37
42
48
48
The following table shows the number of students of 7 colleges participating in extra curricular activities:
Read the table and answer questions 86 to 90.
The median of data pertaining to activity III is
540
229
153
153
The following table shows the number of students of 7 colleges participating in extra curricular activities:
Read the table and answer questions 86 to 90.
The college in which minimum number of students participate in extra curricular activities is
D
G
F
F
The following table shows the number of students of 7 colleges participating in extra curricular activities:
Read the table and answer questions 86 to 90.
The ratio of total number of students in II and I is
1 : 2
9 : 20
19 : 7
19 : 7
The table given below shows production of five types of cars by a company from the year 1998 - 2003. Study the table and answer the question.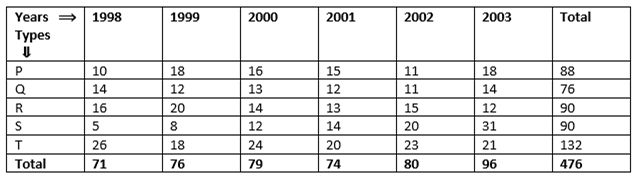
In which year the production of cars of all types taken together was approximately equal to the average of the total production during the period?
2002
1998
1999
2000


 Switch


