 Short Answer Type
Calculate investment expenditure from the following data about an economy which is in equilibrium:
National income = 1000
Marginal propensity to save = 0.25
Autonomous consumption expenditure = 200
Government raises its expenditure on producing public goods. Which economic value does it reflect? Explain.
 Long Answer Type
Calculate national income and gross national disposable income from the following:
(Rs.)
1. Net current transfers to abroad (-) 15
2. Private final consumption expenditure 600
3. Subsidies 20
4. Government final consumption expenditure 100
5. Indirect tax 120
6. Net imports 20
7. Consumption of fixed capital 35
8. Net change in stocks (-10)
9. Net factor income to abroad 5
10. Net domestic capital formation 110
Explain national income equilibrium through aggregate demand and aggregate supply. Use diagram. Also explain the changes that take place in an economy when the economy is not in equilibrium.
Outline the steps required to be taken in deriving saving curve from the given consumption curve. Use diagram.
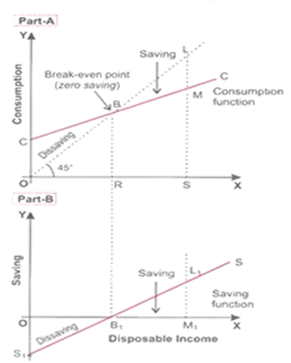
In part A, CC curve shows consumption function corresponding to each level of income whereas 45o line represents the income. Each pointy on 45o line is equidistant from X axis and Y axis. C curve intersects 45o line at point B at which BR=OR i.e. consumption = income. Therefore, point B is called break-even point showing zero saving.
It emphasizes that saving curve must intersect x-axis at the same income level where consumption curve and 45o line intersect. Further, it will be seen that to the left of point B, consumption function lies above 45o line showing that consumption is more than income, i.e. negative saving and to the right of point B, consumption function lies below 45o line showing positive saving.
In part B, we derive saving function in the form of saving curve. In part A, the amount of saving is the vertical distance of Part A representing saving/ dissaving and by joining them, we derive a saving curve. For instance, at 0(Zero) level, of income in Part A, vertical distance OC is plotted as OS1 below X axis in Part B.
Similarly, At OR level of income in Part A, vertical distance at point B being nil is shown as point B1 on X axis in lower part of the figure. Likewise, LM vertical distance of part A is shown as L1M1 in part B. By joining points S, B1 and L1 in the lower segment, we get saving curve. Thus saving curve or function is diagrammatically derived from consumption curve or function.


 Switch


