Short Answer Type
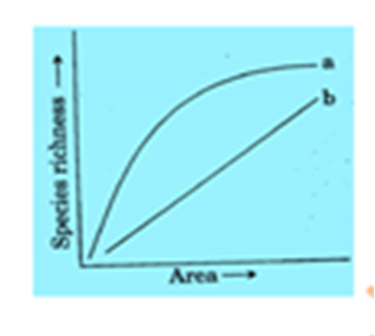
The curve represents Species-Area relationships.
Curve “a” is represented by the equation S = CAz
Where,
S= Species richness
Az= Area Z = slope of the line (regression coefficient)
C = Y-intercept
Characteristic feature-
1. Within a region richness of species increases with exploration of new areas but only upto a limit.
2. Straight line represent in the graph represent logarithmic value of species richness.
Differentiate between in-situ and ex-situ approaches of conservation / of biodiversity.
The cell division involved in gamete formation is not of the same type in different organisms. Justify.


 Switch