 Short Answer Type
(a) Organisms may be conformers or regulators. Explain this statement and give one example of each.
(b) Why are there more conformers than regulators in the animal world ?
Describe the inter-relationship between productivity, gross primary productivity and net productivity.
 Long Answer Type
It is commonly observed that parents feel embarrassed to discuss freely with their adolescent children about sexuality and reproduction. The result of this parental inhibition is that the children go astray sometimes.
(a) Explain the reasons that you feel are behind such embarrassment amongst some parents to freely discuss such issues with their growing children.
(b) By taking one example of a local plant and animal, how would you help these parents to overcome such inhibitions about reproduction and sexuality ?
(a) When a seed of an orange is squeezed, many embryos, instead of one are observed. Explain how it is possible.
(b) Are these embryos genetically similar or different ? Comment.
(a) Compare, giving reasons, the J-shaped and S-shaped models of population growth of a species.
(b) Explain ‘fitness of a species’’ as mentioned by Darwin.
(a) There are 2 models of population growth : (i) The exponential growth (ii) Logistic growth (i) Exponential growth : This growth occurs where the resources (food + space) are unlimited. The equation can be represented as dt dN = (b – d) × N Let (b – d) = r rN dt dN = or rt t 0 N = N e N = population size Nt = population density after time t. N0 = population density at time zero r = growth rate b = birth rate d = death rate In this growth, when N in relation to time is plotted on graph, the curve becomes J-shaped.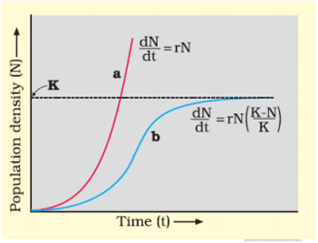
(a) J-shaped curve ⇒ exponential growth
(b) S-shaped curve ⇒ logistics growth
Every ecosystem has limited resources to support a particular maximum carrying capacity (K). When N is plotted in relation to time t, a sigmoid-S-shaped curve is obtained & is also called as VERHULST-PEARL logistic growth. The equation is : dt dN = rN K (K − N) N = population density at time t. r = growth rate K = carrying capacity.
Write the different components of a lac-operon in E. coli. Explain its expression while in an ’open’ state.


 Switch


