 Short Answer Type
Calculate Gross Value Added at Factor Cost:
| (i) | Units of output sold (units) | 1000 |
| (ii) | Price per unit of output | 30 |
| (iii) | Depreciation(Rs.) | 1000 |
| (iv) | Intermediate cost (Rs.) | 12000 |
| (v) | Closing stock (Rs.) |
Outline the steps taken in deriving saving curve from the consumption curve. Use diagram.
Consumption + savings = income.
It implies consumption and savings curves representing consumption and saving functions are complementary curves. Therefore, saving function or curve can be directly derived from consumption curve.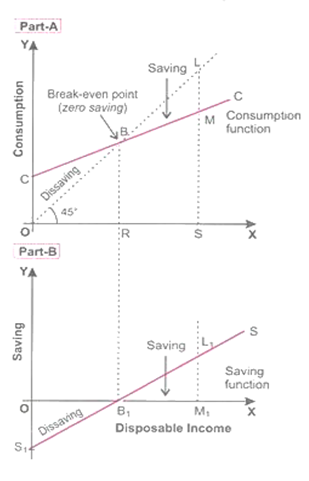
In part A, CC curve shows consumption function corresponding to each level of income whereas 45o line represents income. Recall that each point on 45o line is equidistant from
X-axis and Y- axis. C curve intersects 45o line at point B where consumption = Income. Therefore, point B is called Break-even point showing zero saving.
It emphasises that saving curve must intersect X- axis at the same income level where consumption curve and 45o line intersect. Further, it will be seen that to the left of point B, consumption function lies above 45o line showing that consumption is more than income ie. Negative saving and to the right of point B, consumption function lies below 45o line showing positive saving.
In Part B, we derive saving function in the form of saving curve. In Part A, the amount of saving is the vertical distance between C curve and 45o line. By plotting Part B, the vertical distance of Part A representing saving and by joining them, we derive a saving curve.
Similarly, at OR level of income Part A, vertical distance at point B being nil is shown as point B1 on X-axis in lower part of the figure. Likewise, LM vertical distance of Part A is shown as L1M1 in Part B. By joining points S, B1 and L1 in lower segment, we get saving curve. Thus, saving curve/function is diagrammatically derived from consumption curve/function.
| Autonomous consumption | Rs. 100 |
| Marginal Propensity to consume | Rs. 0.80 |
| Investment | Rs. 50 |
Distinguish between Revenue Expenditure and Capital Expenditure in a government budget. Give examples.


 Switch


