 Multiple Choice Questions
If the cost price of 10 articles is equal to the selling price of 8 articles, then gain per cent is
10%
8%
50%
25%
An article is marked 40% above the cost price and a discount of 30% is allowed. What is the gain or loss percentage?
10% gain
5% gain
2% loss
12% loss
A man bought orange at the rate of 8 for ₹ 34 and sold them at the rate of 12 for ₹ 57. How many oranges should be sold to earn a net profit of ₹ 45?
90
100
135
150
A man sells two articles for ₹ 5000 each neither losing nor gaining in the deal. If he sold one of them at a gain of 25%, the other article is sold at a loss of


By selling an article for ₹ 144, a person gained such that the percentage gain equals the cost price of the article. The cost price of the article is
₹ 90
₹ 80
₹ 75
₹ 60
The average age of 11 players of a cricket team is increased by 2 months when two of them aged 18 yr and 20 yr are replaced by two new players. The average age of the new players is
19 yr 1 month
19 yr 6 months
19 yr 11 months
19 yr 5 months
The following graph shows the production of wheat flour (in 1000 tonnes) by three companies X, Y and Z over the year. Study the graph and answer questions given below.
What is the difference between the production of company Z in 2004 and company Y in 2000 (in thousand tonnes)?
2000
100
20
2
The following graph shows the production of wheat flour (in 1000 tonnes) by three companies X, Y and Z over the year. Study the graph and answer questions given below.
What is the ratio of the average production of company X in the period 2002-2004 to the average production of company Y in the same period?
1 : 1
15 : 17
23 : 25
27 : 29
C.
23 : 25
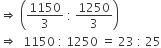
Average production of company X in 2002 - 2004:
Average production of company Y in 2002 - 2004: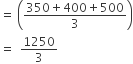
∴ Required ratio:
The following graph shows the production of wheat flour (in 1000 tonnes) by three companies X, Y and Z over the year. Study the graph and answer questions given below.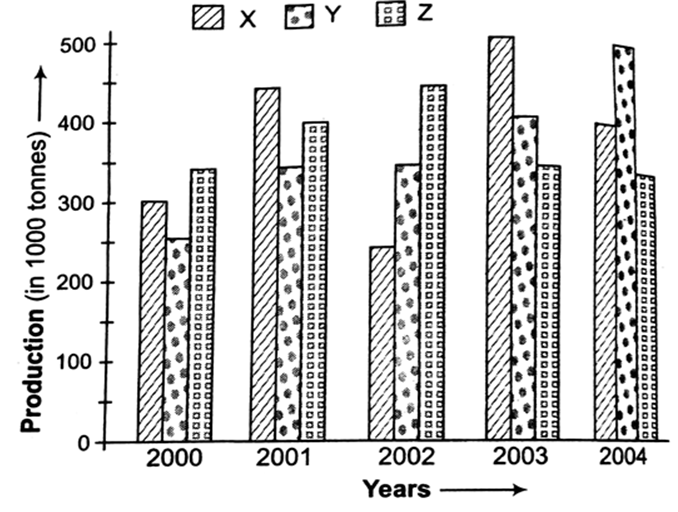
What is the percentage increase in the production of company Y from 2002 to 2003?


25
40
The following graph shows the production of wheat flour (in 1000 tonnes) by three companies X, Y and Z over the year. Study the graph and answer questions given below.
The average production for five year was maximum for which company?
Both X and Z
Y
Z
Both X and Y


 Switch


