 Multiple Choice Questions
When the angle of elevation of the sun increases from 30° to 60°, the shadow of a post is diminished by 5 m. Then, the height of the post is
5√3 / 2 m
2√3 / 5 m
2 / 5√3 m
4 / 5√3 m
If sin θ + sin2θ = 1, then the value of cos12 θ + 3 cos 10 θ + 3 cos8 θ + cos6 θ - 1 is
0
1
-1
2
Read the given information carefully and the questions given below.
Population of five adjacent areas of a town, in the year of 2010, are represented in the following pie-chart. The ratio of the numbers of males to that of females in these areas are stated in the table below. The total population in all the five years is 72 lakh.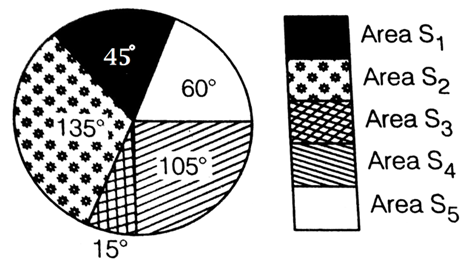
Ratio of numbers of males (M) to females (F)
12 lakh is the population of the area
S1
S3
S5
S4
Read the given information carefully and the questions given below.
Population of five adjacent areas of a town, in the year of 2010, are represented in the following pie-chart. The ratio of the numbers of males to that of females in these areas are stated in the table below. The total population in all the five years is 72 lakh.
The number of males in the areas S1 and S4 together is
13.8 lakh
8.2 lakh
16.2 lakh
15.8 lakh
Read the given information carefully and the questions given below.
Population of five adjacent areas of a town, in the year of 2010, are represented in the following pie-chart. The ratio of the numbers of males to that of females in these areas are stated in the table below. The total population in all the five years is 72 lakh.
The ratio of number of females in the area S2 to that in the area S5 is
7 : 9
36 : 13
9 : 7
13 : 36
Read the given information carefully and the questions given below.
Population of five adjacent areas of a town, in the year of 2010, are represented in the following pie-chart. The ratio of the numbers of males to that of females in these areas are stated in the table below. The total population in all the five years is 72 lakh.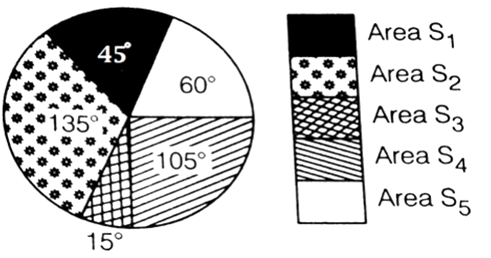
If in the year 2010, there was an increase of 5% population in the area S1 and 8% increase in population of the area S3 compared to the previous year, then the ratio of population in the areas S1 and S3 in the year 2009 was
108 : 35
27 : 10
27 : 70
10 : 3
Read the given information carefully and the questions given below.
Population of five adjacent areas of a town, in the year of 2010, are represented in the following pie-chart. The ratio of the numbers of males to that of females in these areas are stated in the table below. The total population in all the five years is 72 lakh.
The average of females population in all the five areas is lower than the female population in each of the areas
S1 and S2
S2 and S5
S2 and S4
S4 and S5


 and
and  , then the value of x2y2 (x2 + y2 + 3) is
 and
and  then the value of x2 + 4y2 is
 Switch


