 Multiple Choice Questions
A farmer travelled a distance of 61 km in 9h. He travelled partly on foot at the rate of 4 km/h and partly on bicycle at the rate of 9 km/h. The distance travelled on foot is
14 km
17 km
15 km
16 km
The perimeter of one face of a cube is 20 cm. Its volume will be
400 cm3
125 cm3
625 cm3
100 cm3
Study pie-chart and answer the following question.
The following pie-chart shows the sources of funds to be collected by the National Highways Authority of India (NHAI) for its Phase II projects.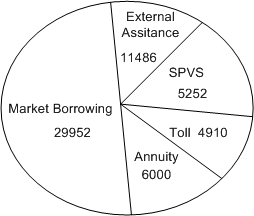
If NHAI could receive a total of ₹ 9695 crore as External Assistance, by what percent (approximately) should it increase the Market Borrowing to arrange for the shortage of funds?
8
6
4.5
7.5
Study pie-chart and answer the following question.
The following pie-chart shows the sources of funds to be collected by the National Highways Authority of India (NHAI) for its Phase II projects.
The central angle corresponding to Market Borrowing is
187.2°
137.8°
192.4°
52°
Study pie-chart and answer the following question.
The following pie-chart shows the sources of funds to be collected by the National Highways Authority of India (NHAI) for its Phase II projects.
If the toll is to be collected through an outsourced agency by allowing a maximum 10% commission, how much amount should be permitted to be collected by the outsourced agency, so that the project is supported with Rs. 4910 crores?
₹ 5401 crore
₹ 6213 crore
₹ 5827 crore
₹ 5316 crore
Study the following bar diagram carefully and answer the following question.
The number of the production of electronic items (T Vs and LCDs) in a factory during the period from 2009 to 2013.
3 : 4
2 : 3
4 : 3
1 : 4
Study the following bar diagram carefully and answer the following question.
The number of the production of electronic items (T Vs and LCDs) in a factory during the period from 2009 to 2013.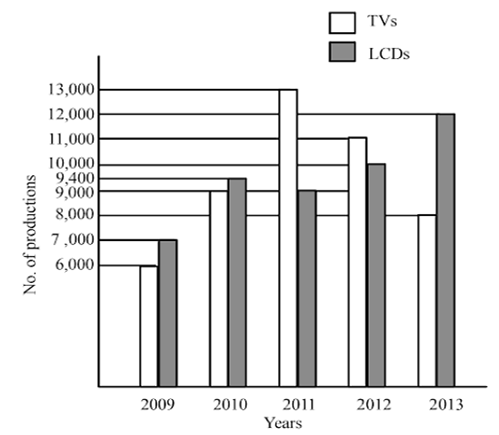
The difference between averages of production of TVs and LCDs from 2009 to 2012 is
700
800
900
600
Study the following bar diagram carefully and answer the following question.
The number of the production of electronic items (TVs and LCDs) in a factory during the period from 2009 to 2013.
The ratio of production of TVs in the years 2009 and 2010 is
7 : 6
6 : 7
2 : 3
3 : 2
Study the following bar diagram carefully and answer the following question.
The number of the production of electronic items (TVs and LCDs) in a factory during the period from 2009 to 2013.
The total number of production of electronic items is maximum in the year
2011
2013
2009
2010
A ship after sailing 12 km towards South from a particular place covered 5 km more towards East. Then, the straightway distance of the ship from that place is
11 km
18 km
13 km
15 km


