 Multiple Choice Questions
A solid sphere and a solid hemisphere have the same total surface area. The the ratio of their volume is


The pie graph indicates the breakup of the cost of construction of a house. Assuming that the total cost of construction is ₹ 6,00,000/-, answer the following questions.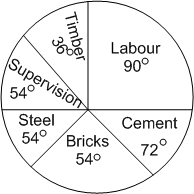
The amount spent on timber is
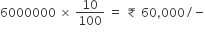
A.
₹ 60,000/-Percentage of amount spent on Timber
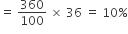
Therefore, required amount
The pie graph indicates the breakup of the cost of construction of a house. Assuming that the total cost of construction is ₹ 6,00,000/-, answer the following questions.
The amount spent on labour exceeds the amount spent on supervision by
₹ 1,20,000/-
₹ 60,000/-
₹ 60,000/-
The pie graph indicates the breakup of the cost of construction of a house. Assuming that the total cost of construction is ₹ 6,00,000/-, answer the following questions.
The amount spent on labour exceeds the amount spent on steel by:
10% the total cost
11% of the total cost
13% of the total cost
13% of the total cost
The pie graph indicates the breakup of the cost of construction of a house. Assuming that the total cost of construction is ₹ 6,00,000/-, answer the following questions.
The percentage of the total cost of construction spent on cement, steel and supervision is
50%
55%
60%
60%


 Switch


