 Multiple Choice Questions
Thousand solid metallic spheres of diameter 6 cm are melted and recast into a new solid sphere. The diameter of the new sphere (in cm ) is
30
90
45
45

1980
1981
1983
1983
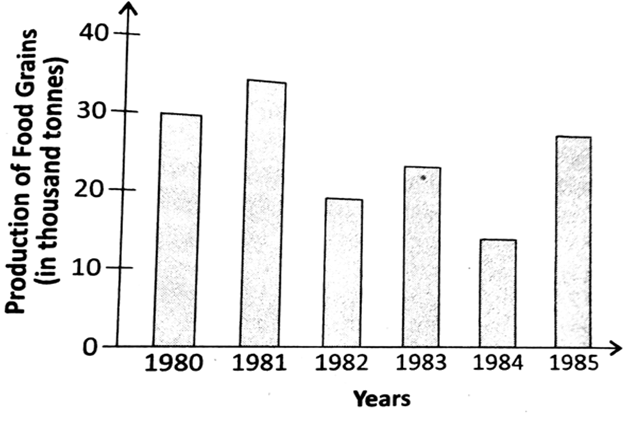
500 tonnes
1000 tonnes
5000 tonnes
5000 tonnes

1980 and 1981
1982 and 1983
1984 and 1985
1984 and 1985


 Switch


