 Multiple Choice Questions
In a mixture of 25 litres, the ratio of milk to water is 4 : 1. Another 3 litres of water is added to the mixture. The ratio of milk to water in the new mixture is
5 : 1
5 : 2
5 : 3
5 : 4
A constituency is divided into four regions A, B, C and D. Two candidates X and Y contested the last election from that constituency. The adjoining graph gives the break up of voting in the four regions. Study the graph and answer the following questions.
Approximately how much percent of voters voted in favour of X?
45.4%
47.5%
50%
22.5%
B.
47.5%
Number of voters in favour of X = 45 + 73 + 51 + 56 = 225
Number of voters in favour of Y = 40 + 88 + 47 + 51 = 226
Number of voters did not vote = 1 + 9 + 5 + 8 = 23
∴ Total Number of voters = 225 + 226 + 23 = 474
∴ Percentage of voters in favour of x
A constituency is divided into four regions A, B, C and D. Two candidates X and Y contested the last election from that constituency. The adjoining graph gives the break up of voting in the four regions. Study the graph and answer the following questions.
Approximately how much percent of voters did not caste their voters?
4.9%
4.5%
0.23%
23%
A constituency is divided into four regions A, B, C and D. Two candidates X and Y contested the last election from that constituency. The adjoining graph gives the break up of voting in the four regions. Study the graph and answer the following questions.
In region B, Y gets A% more votes than X. Find the value of A?
24%
21%
19%
15%
A constituency is divided into four regions A, B, C and D. Two candidates X and Y contested the last election from that constituency. The adjoining graph gives the break up of voting in the four regions. Study the graph and answer the following questions.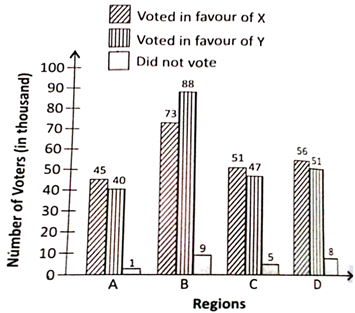
Nearly what percentage of his total votes did X receive from region B?
30%
31%
32%
35%


 Switch


