 Multiple Choice Questions
A 1.6 m tall observer is 45 m away from a tower. The angle of elevation from his eye to the top of the tower is 30°, then the height of the tower (in m) is:
25.98
26.58
27.58
27.98
The following pie-chart shows proportion of population of seven villages in 2009. Study the pie-chart and answer the questions that follow:
If the below poverty line population of the village 'X' is 12160, then the population of village 'S' is
18500
20500
22000
20000
The following pie-chart shows proportion of population of seven villages in 2009. Study the pie-chart and answer the questions that follow:
The ratio of the below poverty line population of village 'T' to that of the below poverty line population of village 'Z' is
11 : 23
13 : 11
23 : 11
11 : 13
The following pie-chart shows proportion of population of seven villages in 2009. Study the pie-chart and answer the questions that follow:
If the population of the village 'R' is 32000, then the below poverty line population of village 'Y' is:
14100
15600
16500
17000
The following pie-chart shows proportion of population of seven villages in 2009. Study the pie-chart and answer the questions that follow: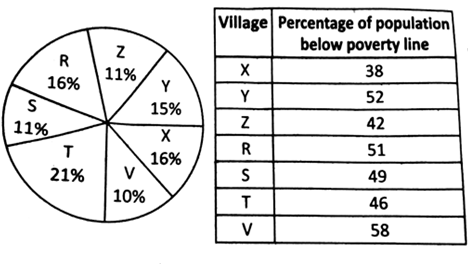
In 2010, the population of 'Y" and 'V' increases by 10% each and the percentage of population below poverty line remains unchanged for all the villages. If in 2009, the population of village Y was 30000, then the below poverty line population of village 'V' in 2010 is ...............
11250
12760
13140
13780
B.
12760
Population of Y in 2009 = 30000
15% = 30000
∴ Total population of all villages

Total population of village 'V' in 2009:
Population of village V in 2010:

∴ Population of village V below poverty line in 2010:


 Switch


