 Multiple Choice Questions
The table below shows the number of students of a college studying Arts, Science, Commerce and Business for given 5 years.
| Year | Art | Science | Commerce | Business |
| 2012 | 48 | 105 | 148 | 32 |
| 2013 | 56 | 123 | 136 | 30 |
| 2014 | 64 | 125 | 144 | 36 |
| 2015 | 78 | 148 | 156 | 36 |
| 2016 | 92 | 161 | 168 | 48 |
What is the percentage increase in number of students of Commerce from 2012 to 2016?
11.16%
17.28%
13.51%
15.67%
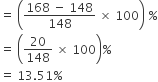
C.
13.51%
Number of students in 2012 = 148
Number of students in 2016 = 168
∴ Required percentage increase:
The table below shows the number of students of a college studying Arts, Science, Commerce and Business for given 5 years.
| Year | Art | Science | Commerce | Business |
| 2012 | 48 | 105 | 148 | 32 |
| 2013 | 56 | 123 | 136 | 30 |
| 2014 | 64 | 125 | 144 | 36 |
| 2015 | 78 | 148 | 156 | 36 |
| 2016 | 92 | 161 | 168 | 48 |
What is the simple annual growth rate (in %) of the number of students of Business from 2012 to 2016?
10%
12.5%
15%
17.5%
The table below shows the number of students of a college studying Arts, Science, Commerce and Business for given 5 years.
| Year | Art | Science | Commerce | Business |
| 2012 | 48 | 105 | 148 | 32 |
| 2013 | 56 | 123 | 136 | 30 |
| 2014 | 64 | 125 | 144 | 36 |
| 2015 | 78 | 148 | 156 | 36 |
| 2016 | 92 | 161 | 168 | 48 |
What is the ratio of average number of students studying Arts per year and average number of students studying Science per year?
169 : 331
66 : 169
127 : 261
32 : 75
The table below shows the number of students of a college studying Arts, Science, Commerce and Business for given 5 years.
| Year | Art | Science | Commerce | Business |
| 2012 | 48 | 105 | 148 | 32 |
| 2013 | 56 | 123 | 136 | 30 |
| 2014 | 64 | 125 | 144 | 36 |
| 2015 | 78 | 148 | 156 | 36 |
| 2016 | 92 | 161 | 168 | 48 |
Which year shows the maximum percentage increase in the total number of students in these 4 subjects over the previous year?
2013
2014
2015
2016


 Switch


