Briefly explain the following concepts.
(a) Indifference curve and its properties.
(b) Indifference map.
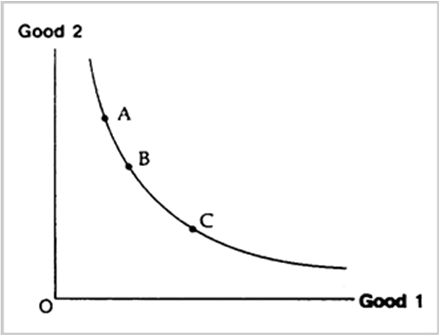
Fig. 2.4
Properties of indifference curves are :
1. Indifference curves always slope down from left to the right. It is negatively sloped because when consumer increases consumption of good-1, he must reduce consumption of good-2 so as to keep utility level unchanged.
2. Higher indifference curves represent higher level of satisfaction. It is so because higher indifference curve represents more quantity of both the goods.
3. Indifference curves are always convex to the origin O because MRS of two goods continuously fall.
4. Indifference curves cannot touch or intersect each other.
Assumptions. Indifference curve analysis is based on the following assumptions.
(i) A consumer is rational, i.e., he would like to get maximum satisfaction.
(ii) A consumer can rank bundles on the basis of satisfaction.
(iii) Prices of goods and income of consumer are given.
(iv) A consumer's preferences are monotonic.
(b) Indifference Map. "An indifference map is a collection of indifference curves that represent different levels of satisfaction." Simply put a set of indifference curves shown on a single diagram is called indifference map. Remember one indifference curve has one utility level throughout and so different curves show different utility levels. An indifference map gives a complete picture of a consumer's scale of preferences for two goods as it represents different levels of satisfaction. Such a map has been drawn in the adjoining Fig. 2.5 containing different indifference curves. They are numbered in ascending order like IC1, IC2, IC3 and IC4. A higher indifference curve indicates higher level of satisfaction as compared to lower indifference curve. Its reason is that any point on a higher indifference curve means more of both goods or the same quantity of one good and more quantity of other good. Thus IC2 is superior to IC1 IC2 to IC3 and IC4 is superior to IC3. In short higher the position of a curve, the better for the consumer because the higher curve represents greater quantities of both the goods. Briefly put, all the indifference curves taken together constitute the Indifference Map of the consumer. Thus the map describes preferences of a consumer.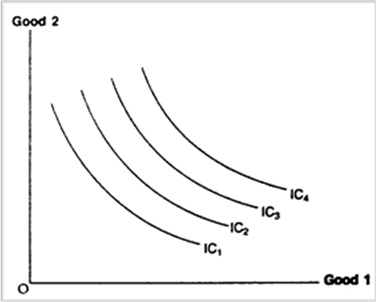
Fig. 2.5
Remember, indifference curve analysis is based on the assumption that preference are monotonic.


