Find mean, median and mode of the following data:
|
Classes |
Frequency |
|
0 - 50 |
2 |
|
50 - 100 |
3 |
|
100 - 150 |
5 |
|
150 - 200 |
6 |
|
200 - 250 |
5 |
|
250 - 300 |
3 |
|
300 - 350 |
1 |
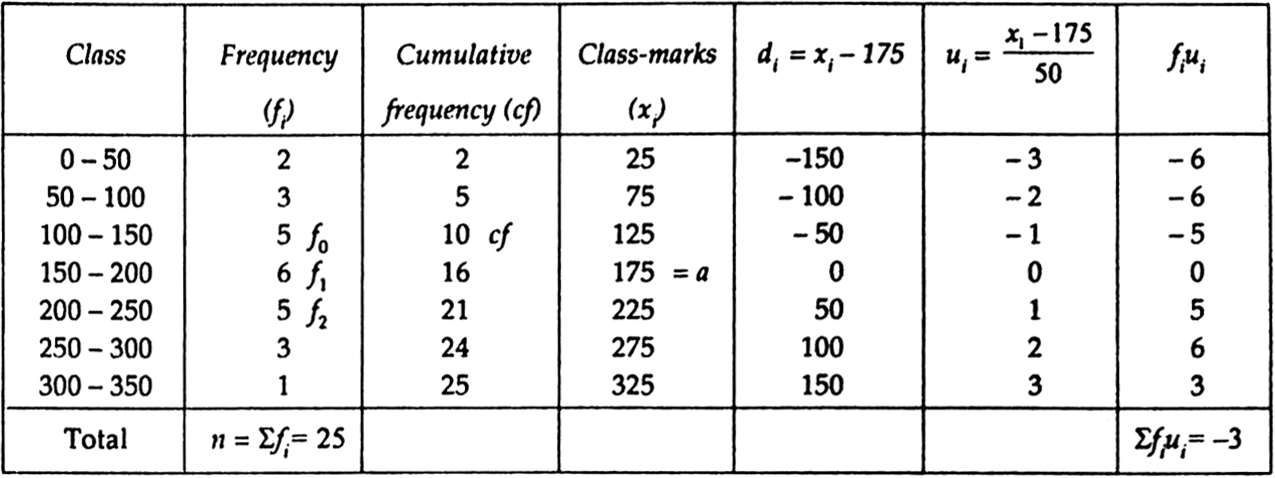
From the table,  |
|
I. Finding Mean :
Now, 150 - 200 is the class whose cumulative frequency 16 is greater than 
Therefore, 150 - 200 is the median class. Thus, the lower limit (l) of the median class is 150.
II. Finding median:
III. Finding mode:
= 150 + 25 = 175
The following table gives the daily income of 50 workers of a factory :
|
Daily income (in Rs.) |
No. of Workers |
|
100-120 |
12 |
|
120-140 |
14 |
|
140-160 |
8 |
|
160-180 |
6 |
|
180-200 |
10 |
Find the Mean, Mode and Median of the above data.
|
C.I. |
xi |
fi |
fiixi |
c.f |
|
100-120 |
110 |
12 |
1320 |
12 |
|
120-140 |
130 |
14 |
1820 |
26 |
|
140-160 |
150 |
8 |
1200 |
34 |
|
160-180 |
170 |
6 |
1020 |
40 |
|
180-200 |
190 |
10 |
1900 |
50 |
|
Σfi = 50 |
Σfixi = 7260 |
 Model class is 120 - 140,
  Class size h = 20
 which lies in the class 120 - 140
 l = 120. c.f. = 12, f = 14, h = 20
The table given below shows the frequency distribution of the scores obtained by 200 candidates in a BCA examination.
|
Score |
No. of candidates |
|
200-250 |
30 |
|
250-300 |
15 |
|
300-350 |
45 |
|
350-400 |
20 |
|
400-450 |
25 |
|
450-500 |
40 |
|
500-550 |
10 |
|
550-600 |
15 |
Draw cumulative frequency curves by using (i) 'less than series', (ii) 'more than series'.
e assume a class interval 150-200 prior to the first class interval 200-250 wtih zero frequency.
Cumulative frequency distribution [Less than Series]
|
Scroe |
c.f. |
|
Less than 200 |
0 |
|
Less than 250 |
30 |
|
Less than 300 |
45 |
|
Less than 350 |
90 |
|
Less than 400 |
110 |
|
Less than 450 |
135 |
|
Less than 500 |
175 |
|
Less than 550 |
185 |
|
Less than 600 |
200 |
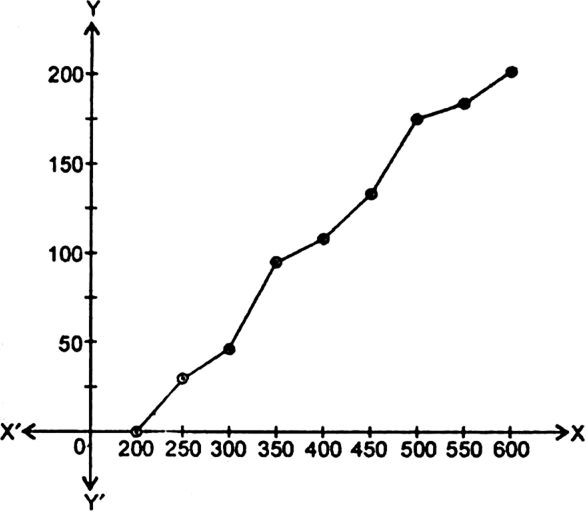
More than Series
|
Scroe |
c.f. |
|
More than 200 |
200 |
|
More than 250 |
170 |
|
More than 300 |
155 |
|
More than 350 |
110 |
|
More than 400 |
90 |
|
More than 450 |
65 |
|
More than 500 |
25 |
|
More than 550 |
15 |
|
More than 600 |
0 |
Now, we plot the pts.: (200, 200), (250,170), (300,155), (350,110), (400, 90), (450, 65), (500, 25), (550, 15) and (600, 0).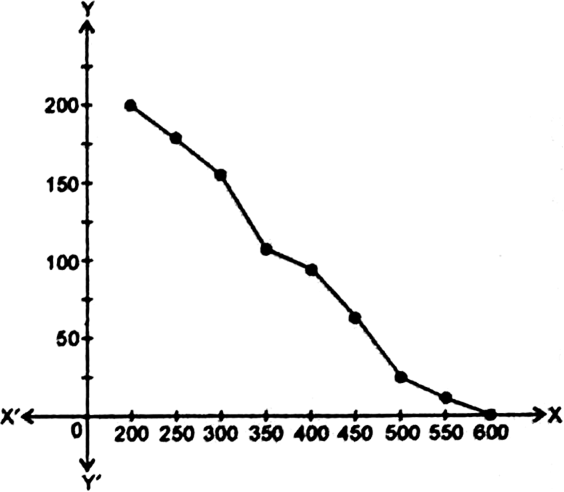
Draw both types of cumulative freqneucy curve on the same graph paper and then determine the median.
|
Marks obtained |
No. of students |
|
50-60 |
4 |
|
60-70 |
8 |
|
70-80 |
12 |
|
80-90 |
6 |
|
90-100 |
6 |
c.f. distribution table :
|
Marks |
No. of students |
c.f. (Less than) |
c.f (More tlian) |
|
50-60 |
4 |
4 |
36 |
|
60-70 |
8 |
12 |
32 |
|
70-80 |
12 |
24 |
24 |
|
80-90 |
6 |
30 |
12 |
|
90-100 |
6 |
36 |
6 |
Now, we plot the points (60,4), (70,12), (80,24), (90,30), (100,36), for less than series.
And. (50,36), (60,32), (70,24), (80,12), (90,6) for more than series.
The two curves drawn intersect each other at point, say P. Through this point P, draw a vertical line, which meets x-axis at 76.
So, median = 76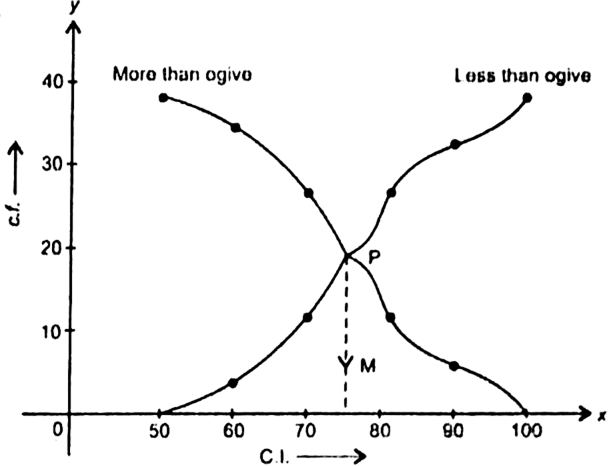
Draw 'less than' and 'more than' ogive curve from the following and indicate the value of median.
|
Marks |
No. of students (f) |
|
0-5 |
7 |
|
5-10 |
10 |
|
10-15 |
20 |
|
15-20 |
13 |
|
20-25 |
12 |
|
25-30 |
10 |
|
30-35 |
14 |
|
35-40 |
9 |
c.f. distribution
|
Marks |
No. of students |
c.f. (Less than) |
c.f (More than) |
|
0-5 |
7 |
7 |
95 |
|
5-10 |
10 |
17 |
88 |
|
10-15 |
20 |
37 |
78 |
|
15-20 |
13 |
50 |
58 |
|
20-25 |
12 |
62 |
45 |
|
25-30 |
10 |
72 |
33 |
|
30-35 |
14 |
86 |
23 |
|
35-40 |
9 |
95 |
9 |
Now we plot the points (5,7), (10,17), (15,37), (20, 50), (25, 62), (30, 72), (35, 86), (40, 95) for less than series. And (0,95), (5,88), (10,78), (15,58), (20, 45), (25,33), (30,23), (35,9) for more than series.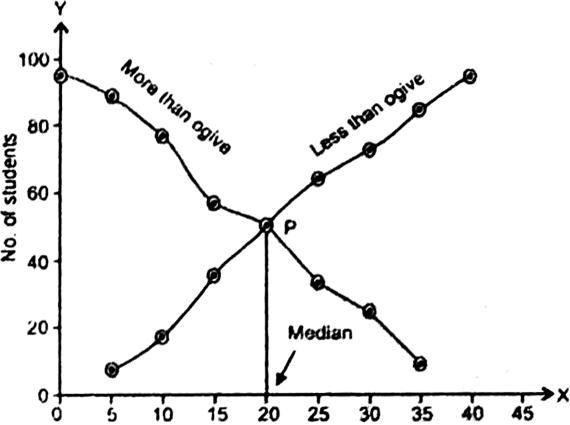
The two curves drawn intersect each other at P. Through this P, draw a vertical line, which meets the x-axis at 20. So median = 20.


 Switch


