
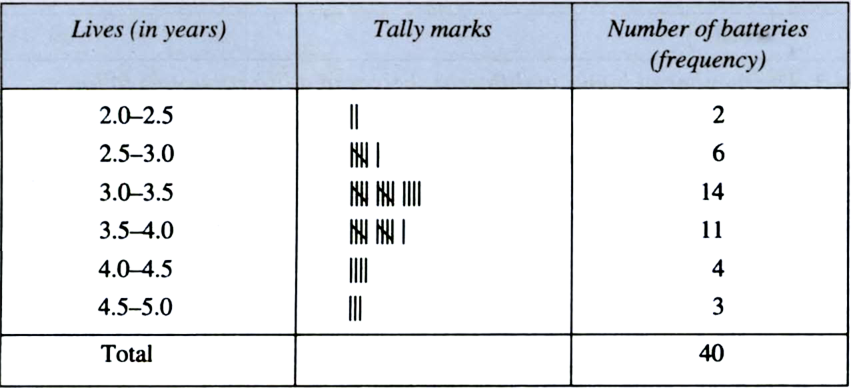
A company manufactures car batteries of a particular type. The lives (in years) of 40 such batteries were recorded as follows:
2.6 3.0 3.7 3.2 2.2 4.1 3.5 4.5
3.5 2.3 3.2 3.4 3.8 3.2 4.6 3.7
2.5 4.4 3.4 3.3 2.9 3.0 4.3 2.8
3.5 3.2 3.9 3.2 3.2 3.1 3.7 3.4
4.6 3.8 3.2 2.6 3.5 4.2 2.9 3.6
Construct a grouped frequency distribution table for this data, using class intervals of size 0.5 starting from the interval 2–2.5.
A survey conducted by an organisation for the cause of illness and death among the women between the ages 15—44 (in years) worldwide, found the following figures (in %):
|
S.No. |
Causes |
Female fatality rate (%) |
|
1. |
Reproductive health conditions |
31.8 |
|
2. |
Neuropsychiatric conditions |
25.4 |
|
3. |
Injuries |
12.4 |
|
4. |
Cardiovascular conditions |
4.3 |
|
5. |
Respiratory conditions |
4.1 |
|
6. |
Other causes |
22.0 |
(i) Represent the information given above graphically.
(ii) Which condition is the major cause of women–s ill health and death worldwide?
(iii) Try to find out, with the help of your teacher, any two factors which play a major role in the cause in (ii) above being the major cause.
(i)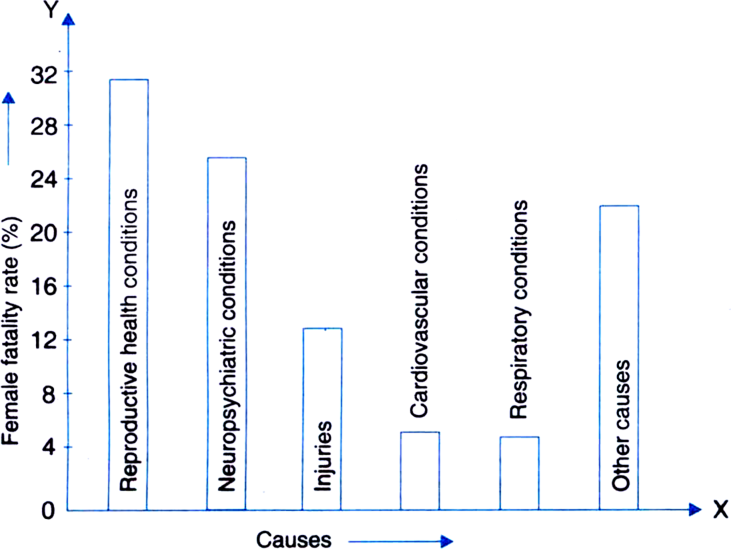
(ii) Reproductive health conditions is the major cause of women’s ill health and death worldwide.
(iii) Lack of proper diet, lack of advised exercises.
The following data on the number of girls (to the nearest ten) per thousand boys in different sections of the Indian society is given below:
|
Section |
Number of girls per thousand boys |
|
Scheduled caste (SC) |
940 |
|
Scheduled tribe (ST) |
970 |
|
Non SC/ST |
920 |
|
Backward districts |
950 |
|
Non-backward districts |
920 |
|
Rural |
930 |
|
Urban |
910 |
(i) Represent the information above by a bar graph.
(ii) In the classroom discuss what conclusion can be arrived at from the graph.
(i)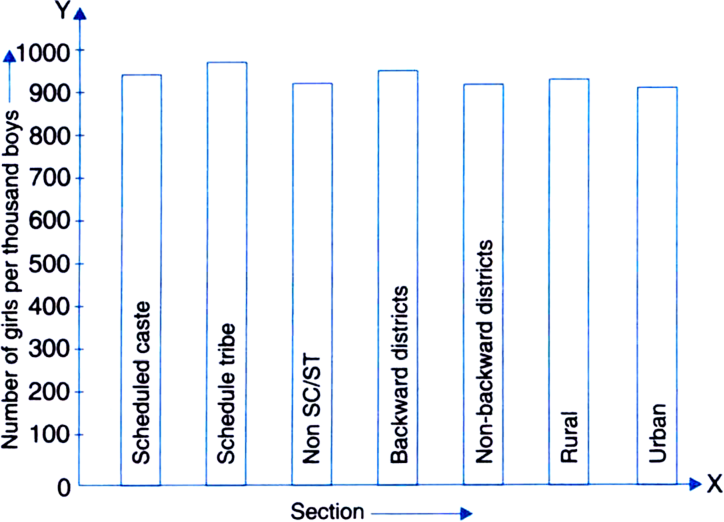
(ii) The two conclusions we can arrive at from the graph are as follows:
(a) The numbers of girls to the nearest ten per thousand boys is maximum in Scheduled Tribe section of the society and minimum in Urban section of the society.
(b) The number of girls to the nearest ten per thousand boys is the same for ‘Non SC/ST’ and ‘Non-backward Districts’ sections of the society.
Given below are the seats won by different political parties in the polling outcome of a state assembly elections:
|
Political party |
A |
B |
C |
D |
E |
F |
|
Seats won |
75 |
55 |
37 |
29 |
10 |
37 |
(i) Draw a bar graph to represent the polling results. [Hint: First make the class intervals continuous.]
(ii) Which political party won the maximum number of seats?
(i)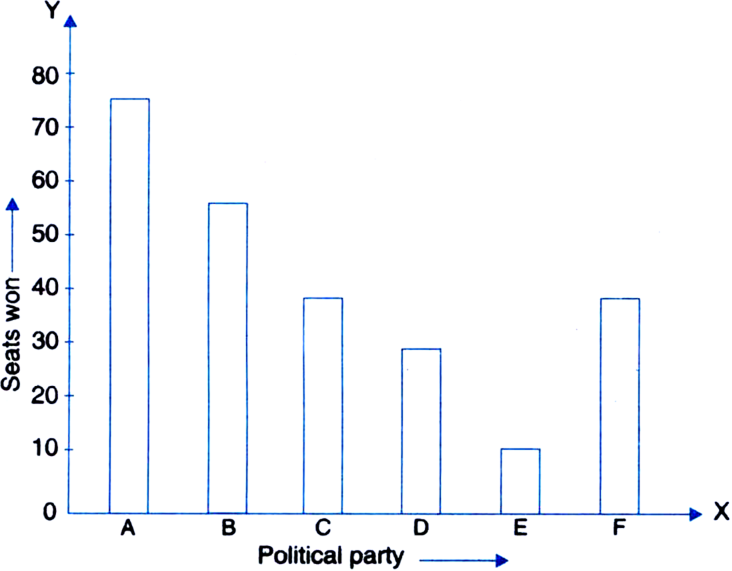
(ii) Political party A won the maximum number of seats.
The length of 40 leaves of a plant are measured correct to one millimetre, and the obtained data is represented in the following table:
|
Length (in mm) |
Number of leaves |
|
118–126 |
3 |
|
127–135 |
5 |
|
136–144 |
9 |
|
145–153 |
12 |
|
154–162 |
5 |
|
163–171 |
4 |
|
172–180 |
2 |
(i) Draw a histogram to represent the given data.
(ii) Is there any other suitable graphical representation for the same data?
(iii) Is it correct to conclude that the maximum number of leaves are 153 mm long? Why?
(i) Modified continuous Distribution
|
Length (in mm) |
Number of leaves |
|
117.5–126.5 |
3 |
|
126.5–135.5 |
5 |
|
135.5–144.5 |
9 |
|
144.5–153.5 |
12 |
|
153.5–162.5 |
5 |
|
162.5–171.5 |
4 |
|
171.5–180.5 |
2 |
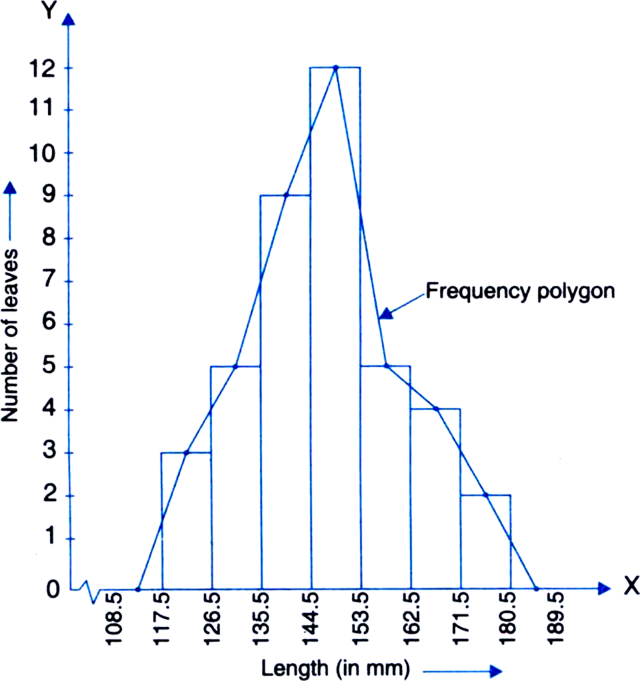
(ii) Frequency Polygon.
(iii) No because the maximum number of leaves have their lengths lying in the interval 145–153.


 Switch


