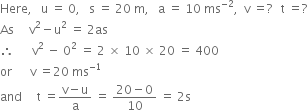
The speed-time graph for a car is shown is Fig. 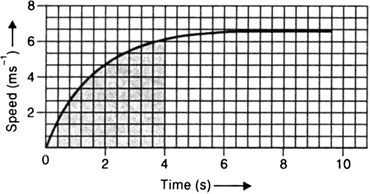
(a) Find how far does the car travel in the first 4 seconds. Shade the area on the graph that represents the distance travelled by the car during the period.
(b) Which part of the graph represents uniform motion of the car?

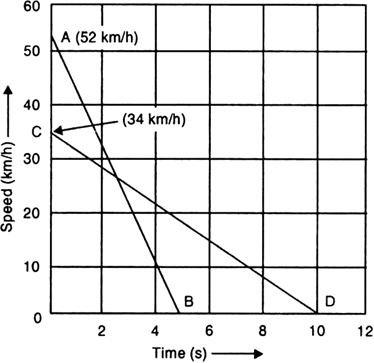
A driver of a car travelling at 52 km h–1 applies the brakes and accelerates uniformly in the opposite direction. The car stops in 5 s. Another driver going at 34 km h–1 in another car applies his brakes slowly and stops in 10 s. On the same graph paper, plot the speed versus time graphs for the two cars. Which of the two cars travelled farther after the brakes were applied?
In Fig. 8.50, AB and CD are the speed-time graphs for the two cars whose initial speeds are 52 km/h and 34 km/h, respectively. 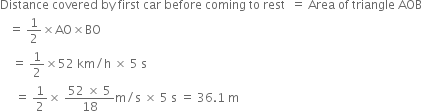 In Fig. AB and CD are the speed-time graphs for the two cars whose initial speeds are 52 km/h and 34 km/h, respectively.
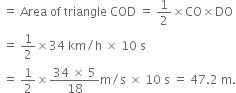

A motorboat starting from rest on a lake accelerates in a straight line at a constant rate of 3.0 m s–2 for 8.0 s. How far does the boat travel during this time?
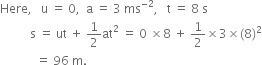
Fig. shows the distance-time graph of three objects A, B and C. Study the graph and answer the following questions:
(a) Which of the three is travelling the fastest?
(b) Are all three ever at the same point on the road?
(c) How far has C travelled when B passes A?
(d) How far has B travelled by the time it passes C?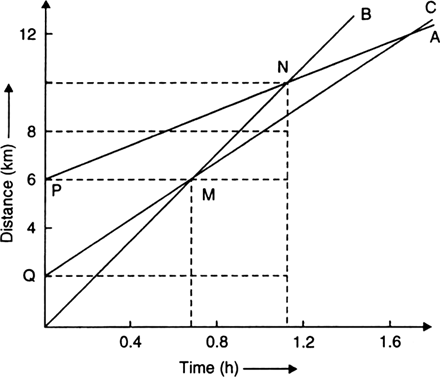

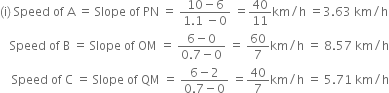
Thus, B is travelling the fastest. Ans.
(ii) No, all three do not meet at any point on the road. Ans.
(iii) When B passes A at point N (at 1.2 hours), C is at a distance of 8 km from the origin O. Ans.
(iv) B passes C at 0.7 hours. During this time B covers distance = 6 km. Ans.


 Switch