Plot distance-time graphs of bodies moving with uniform speeds of 4 m/s and 7 m/s. Compare the graphs.
For a body moving with a uniform speed of 4 m/s 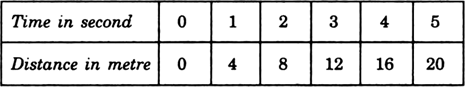
For a body moving with a uniform speed of 7 m/s
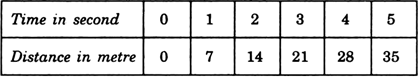
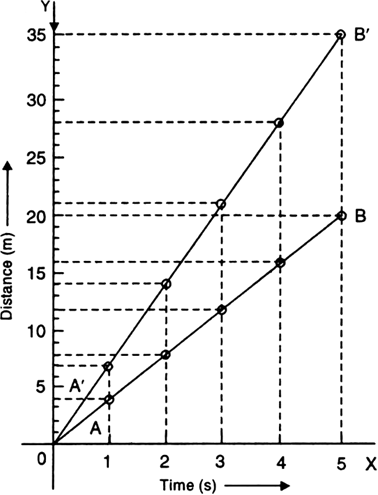
For the body moving with a uniform speed of 4 m/s, the distance-time graph is the straight line AB . For the body moving with a uniform speed of 7 m/s, the distance-time graph is the straight line A'B'. Clearly, slope of graph A'B' is more than that of graph AB.
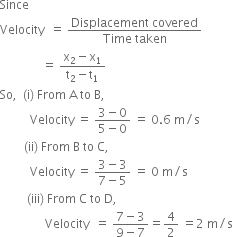
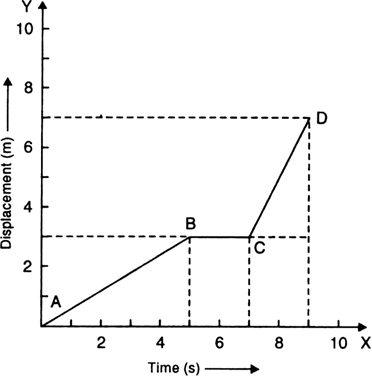
The position of a particle at different times is shown in Fig. 8.24. Calculate the velocity as it moves from A to B, B to C and C to D.
The positions of a ball rolling down an inclined plane at the end of each second are given in the following table:
Plot a displacement-time graph for the motion of the ball. Indicate whether the motion is uniform or non-uniform.
The displacement-time graph for the motion of the ball is as shown in Fig. 8.25. Since this graph is a curve, so motion of the ball is non-uniform. Ans. 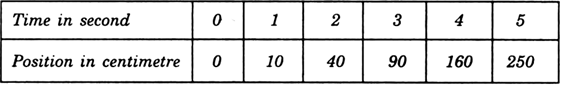
The following is the distance-time table of a moving car. 
(i) Use a graph-paper and plot the distance travelled by the car versus time.
(ii) When was the car travelling with the greatest speed ?
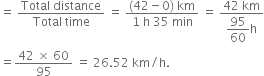
(iii) What is the average speed of the car?
(iv) What is the speed between 11.25 a.m. and 11.40 a.m.?
(v) During a part of the journey, the car was forced to slow down to 12 km/h. At what distance did this happen?
(i) The distance-time graph for the motion of the car is as shown in Fig.
(ii) The car is travelling with maximum speed between 10.40 a.m. and 10.50 a.m. as during this time the distance-time graph has maximum slope. Here
(iii) Average speed of car between 10.05 a.m. and 11.40 a.m.
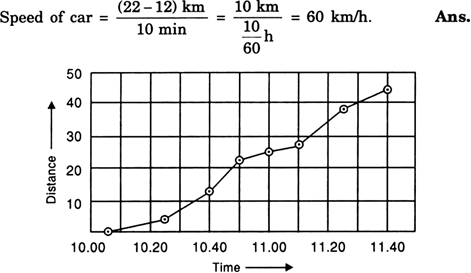
(iv) Speed between 11.25 a.m. and 11.40 a.m.
(v) Between 11.00 a.m. to 11.10 a.m., the car was forced to slow down to 12 km/h. So this happened at a distance of 26 km. Ans.
When a body moves with a uniform speed, its speed-time graph is a straight line parallel to time-axis. In Fig. 8.28, the line AB represents the speed-time graph of a body moving with a uniform speed of 4 m/s, while line A 'B' represents the speed-time graph of a body moving with uniform speed of 7 m/s. The graph A 'B' is at larger distance from time-axis than the graph AB.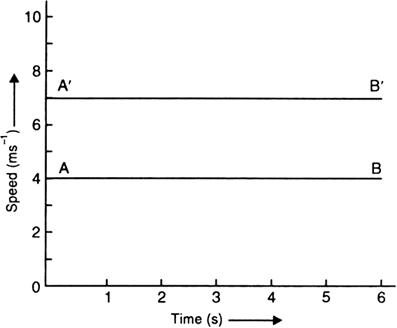


 Switch


