 Multiple Choice Questions
A swimmer swims from a point A against a current for 5 min and then swims backwards in favour of the current for next 5 min and comes to the point B. If AB = 100 m, then the speed of the current in (km/h) is
1
0.6
0.4
0.2
B.
0.6
![]()
Let the speed of boat be x km/hr and speed of current be y km/hr
OA = Distance covered by upstream speed in 5 minutes

OB = Distance covered by downstream speed in 5 minutes

According to the question,
OB - OA = AB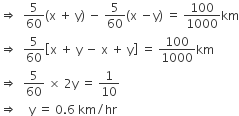
∴ Speed of the current = 0.6 km/hr.
Taking any three of the line segments out of segments of length 2 cm, 3 cm, 5 cm and 6 cm, the number of triangles that can be formed is
1
4
3
2
Arvind purchased a wrist watch with 30% discount on the labelled price. He sold it with 40% profit on the price he bought. What was his per cent loss on the labelled price?
4
8
2
6
The adjoining diagram is frequency polygon for the scores of students in a test. What is the total number of students appeared in the test?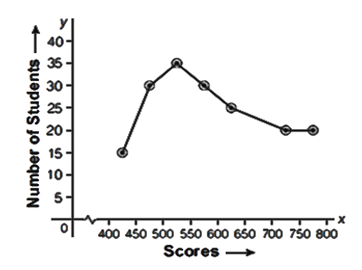
250
175
180
200
The table given below shows production of five types of cars by a company from the year 1998 - 2003. Study the table and answer the question.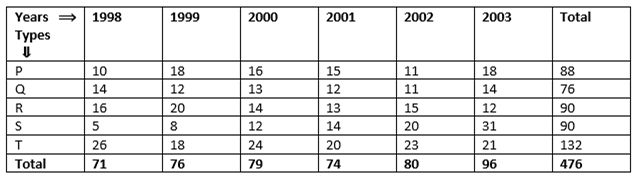
In which year the production of cars of all types taken together was approximately equal to the average of the total production during the period?
2002
1998
1999
2000
Study the graph and answer the questions.
Production of 3 Different Flavours of Health Drinks of a company 6 Years in (lakh bottles)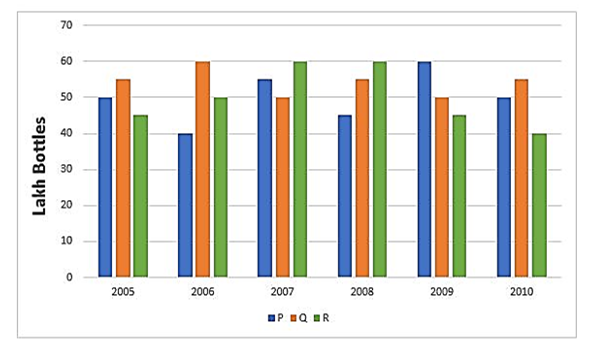
What was the approximate decline in the production of flavour R in 2010 as compared to the production of 2008 in percentage?
30.33%
53.33%
43.33%
33.33%
Study the graph and answer the questions.
Production of 3 Different Flavours of Health Drinks of a company 6 Years in (lakh bottles)
The average annual production of which flavour was maximum in the given period?
Both P and R
Only P
Both P and Q
Only Q
Study the graph and answer the questions.
Production of 3 Different Flavours of Health Drinks of a company 6 Years in (lakh bottles)
The percentage of the total production of flavour R in 2007 and 2008 with respect to the production of flavour P in 2005 and 2006 is
133.33%
97.67%
102.25%
115.35%
Study the graph and answer the questions.
Production of 3 Different Flavours of Health Drinks of a company 6 Years in (lakh bottles)
What is the difference between the average production of flavour Q in 2008, 2009 and 2010 to that of flavour P in 2005, 2006 and 2007 (in lakh bottles)?
5.5
5
50
0.5
Study the graph and answer the questions.
Production of 3 Different Flavours of Health Drinks of a company 6 Years in (lakh bottles)
In which of the following years the percentage rise or fall in production from the previous year maximum for the flavour of Q?
2010
2006
2007
2009


 Switch


