 Multiple Choice Questions
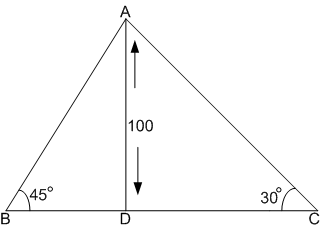
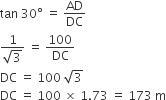
Two ships areВ sailing in the sea on the two sides of a light house. The angle of elevation of the top of the light house as observed from the two ships are 30В° and 45В° respectively. If the light house is 100m high, the distance between the two ships is :(take в€љ3=1.73)
173 m
200 m
273 m
373 m
In these questions, study the figure and answer the questions.
В В The following figure shows the number of students (in thousands) admitted and passed out per year in a college during years 2000 to 2004.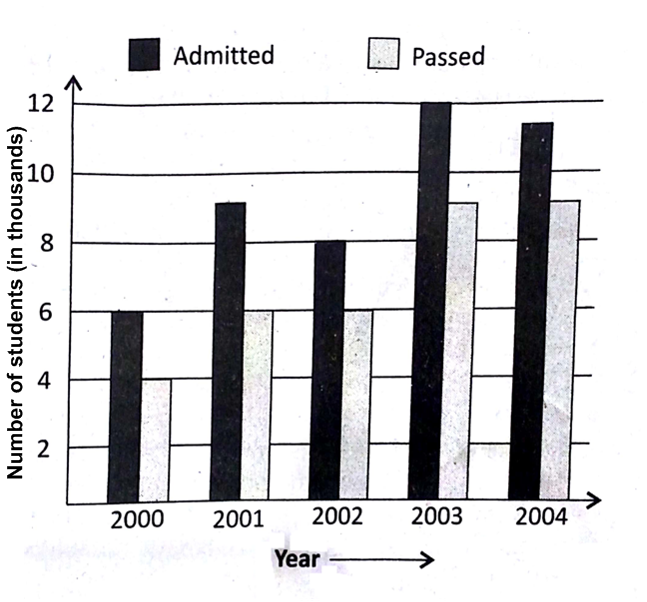
The percent increase in the number of students admitted in the year 2003 over that in 2001 is
133.3%
33.3%
40.3%
40.3%
In these questions, study the figure and answer the questions.
В В The following figure shows the number of students (in thousands) admitted and passed out per year in a college during years 2000 to 2004.
During 2000 to 2003, the ratio of the total number of the students passed out to the total number of students admitted is


2000 and 2001
2003 and 2004
2001 and 2002
2001 and 2002

7 : 8
8 : 9
9 : 8
9 : 8


 Switch


