 Multiple Choice Questions
If cos x = sin y and cot (x - 40°) = tan (50° - y), then the value of x and y are:
x = 70°, y = 20°
x = 75°, y = 15°
x = 85°, y = 5°
x = 80°, y = 10°
C.
x = 85°, y = 5°
cosx = siny
cosx = cos(90° - y)
x = 90° - y
x + y = 90° ...(i)
cot (x - 40°) = tan (50° - y)
cot (x - 40°) = cot (90° - 50° + y)
x - 40° = 40° + y
x - y = 80° ...(ii)
Solving (i) and (ii),
x = 85° and y = 5°
The bar graph shows the number of males and females (in crores) in India during 1951-1991. Read the graph and answer the following questions.
What was the approximate percentage of female population in India during 1991?
48.23%
48.02%
48.03%
48.33%
The bar graph shows the number of males and females (in crores) in India during 1951-1991. Read the graph and answer the following questions.
What was the approximate number of males in India in 1971 per thousand females?
913
1075
1077
1175
The bar graph shows the number of males and females (in crores) in India during 1951-1991. Read the graph and answer the following questions.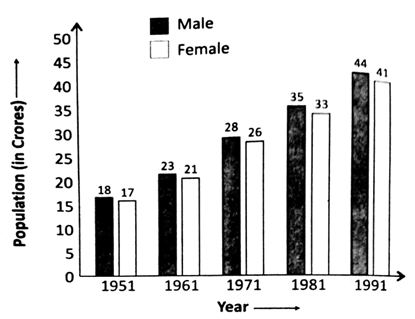
What is the ratio of the numbers of females in India in 1961 per thousand males to the number of males in India in 1991 per thousand females?
943 : 1077
1077 : 943
1073 : 913
861 : 1012
The bar graph shows the number of males and females (in crores) in India during 1951-1991. Read the graph and answer the following questions.
Assuming that the rate of increase in the total population in India during 1991-2001 remains the same as that was during the period 1981-1991, estimate the total population in India in 2001.
105.62 crores
106.25 crores
106.52 crores
105.26 crores


 Switch


