 Multiple Choice Questions
The following graph shows production (in thousands) of two types (P and Q) of vehicles by a factory over the years 2009 to 2014. Study the graph and answer the given questions.
The ratio of total production of Type P vehicles to total production of type Q vehicles over the years is
48 : 41
5 : 8
8 : 5
8 : 5
The following graph shows production (in thousands) of two types (P and Q) of vehicles by a factory over the years 2009 to 2014. Study the graph and answer the given questions.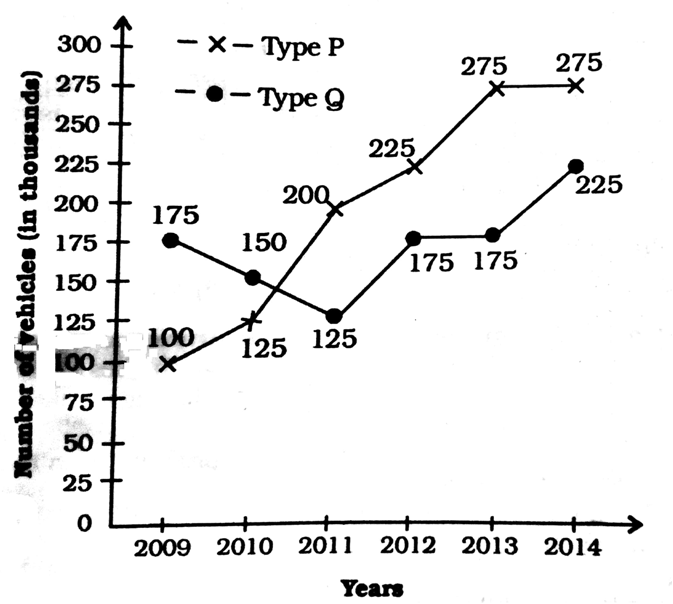
The production of Type Q vehicles in 2010 was approximately what percent of Type vehicles in 2014?
60
45.5
54.5
54.5
The adjoining diagram is frequency polygon for the scores of students in a test. What is the total number of students appeared in the test?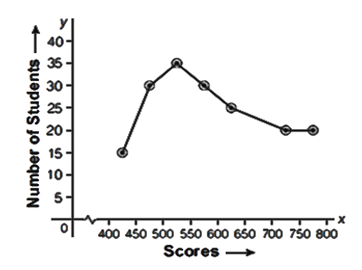
250
175
180
200


