 Multiple Choice Questions
Read the following pie-charts carefully to answer the questions.
Distribution of sales of Hindi and English news papers in five localities A, B, C, D and E.
Hindi News Papers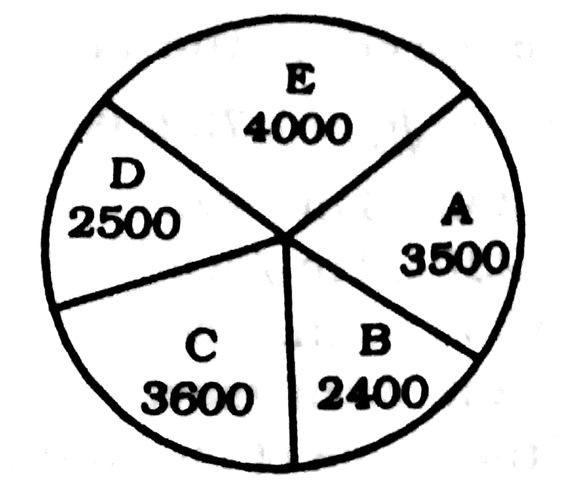
English News Papers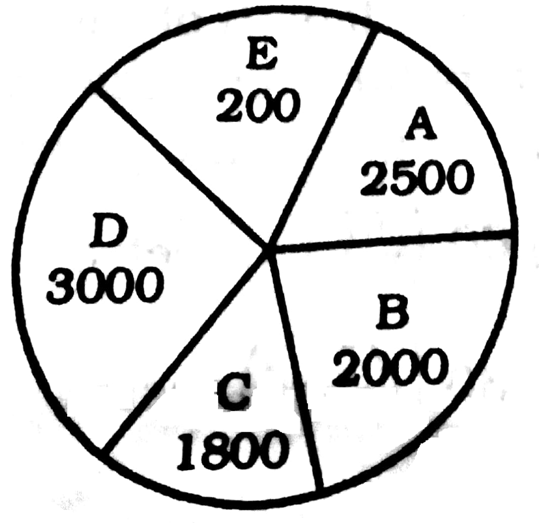
What is the approximate sum of the ratios of sales of English and Hindi newspapers in all localities?
51
50
32
32
Read the following pie-charts carefully to answer the questions.
Distribution of sales of Hindi and English news papers in five localities A, B, C, D and E.
Hindi News Papers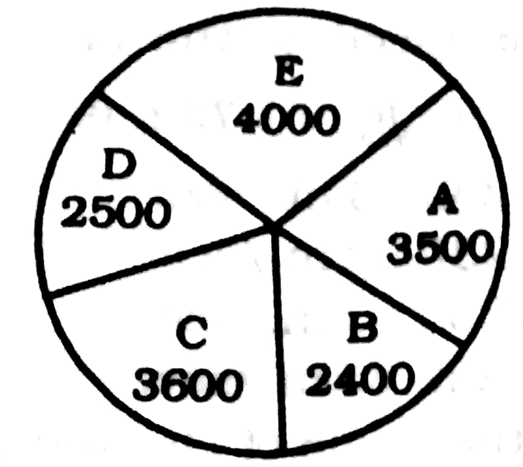
English News Papers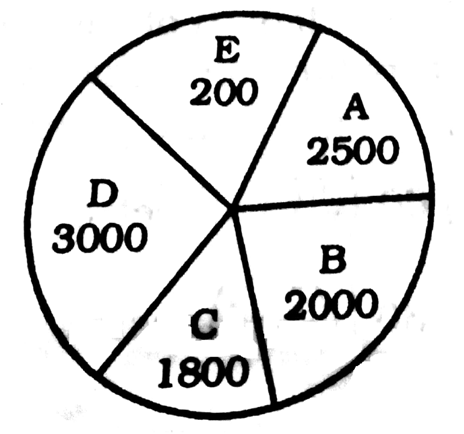
What is the ratio of average number of English newspapers from the localities B, C and E to the average number of Hindi newspapers from the localities A and D?
10 : 19
19 : 10
16 : 33
16 : 33
C.
16 : 33
Required ratio: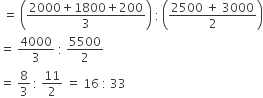
Read the following pie-charts carefully to answer the questions.
Distribution of sales of Hindi and English news papers in five localities A, B, C, D and E.
Hindi Newspapers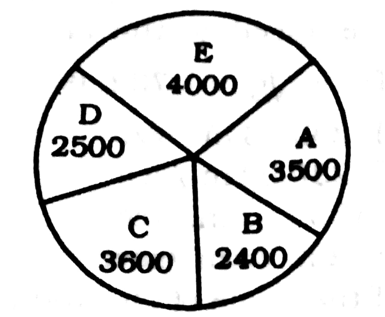
English News Papers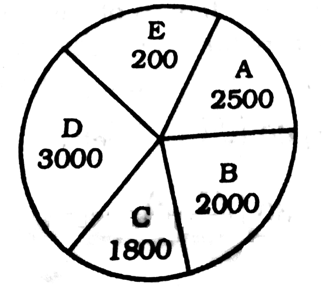
What is the ratio of the average number of sale of English newspapers in localities B and D together to the average sale of Hindi newspapers in all the localities?
25 : 32
40 : 33
33 : 40
33 : 40
In an institution, there are 800 students, Students use different modes of transport for going to the institution and return. The given pie diagram represents the requisite data. Study the diagram carefully and answer the questions.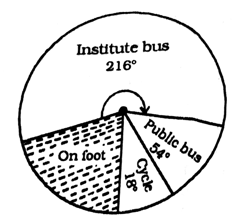
The number of students who travel in public bus is
150
120
130
130
In an institution, there are 800 students, Students use different modes of transport for going to the institution and return. The given pie diagram represents the requisite data. Study the diagram carefully and answer the questions.
The number of students who do not use Institute bus is
330
350
480
480
In an institution, there are 800 students, Students use different modes of transport for going to the institution and return. The given pie diagram represents the requisite data. Study the diagram carefully and answer the questions.
The number of students who go to institute on foot is
160
170
120
120
The annual agricultural production (in tonnes) of an Indian State is given in the pie chart. The total production is 9000 tonnes. Read the pie chart and answer the following question.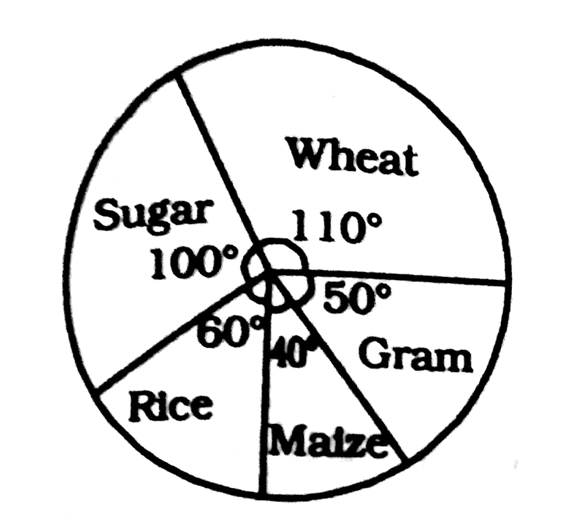
What is the annual production of wheat?
2750 tonnes
3000 tonnes
3540 tonnes
3540 tonnes
The pie chart provided below gives the distribution of land (in a village) under various food crops. Study the pie-chart carefully and answer the questions from 91 to 95.
If the total area under bajra was three hundred acres, then the total area (in hundred acres) under rice and barley together is
18
12
15
15
The pie chart provided below gives the distribution of land (in a village) under various food crops. Study the pie-chart carefully and answer the questions from 91 to 95.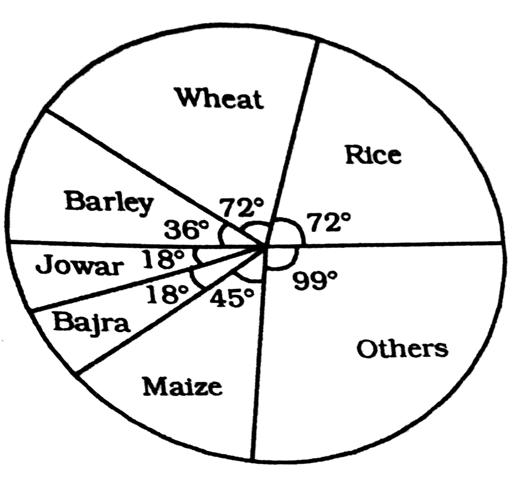
The combination of three crops which contribute to more than 50% of the total area under the food crops is
Wheat, rice and maize
Wheat, rice and jowar
wheat rice and bajra
wheat rice and bajra
The pie chart provided below gives the distribution of land (in a village) under various food crops. Study the pie-chart carefully and answer the questions from 91 to 95.
The ratio of the land used for rice and barley is
3 : 1
1 : 2
2 : 1
2 : 1


 Switch


