 Multiple Choice Questions
Study the following bar diagram carefully and answer the following question.
The number of the production of electronic items (T Vs and LCDs) in a factory during the period from 2009 to 2013.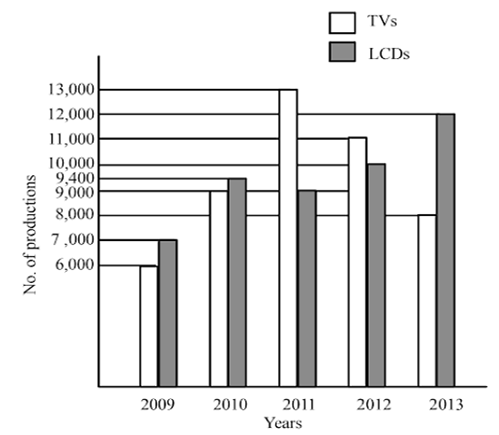
The difference between averages of production of TVs and LCDs from 2009 to 2012 is
700
800
900
600
Study the following bar diagram carefully and answer the following question.
The number of the production of electronic items (TVs and LCDs) in a factory during the period from 2009 to 2013.
The ratio of production of TVs in the years 2009 and 2010 is
7 : 6
6 : 7
2 : 3
3 : 2
Study the following bar diagram carefully and answer the following question.
The number of the production of electronic items (TVs and LCDs) in a factory during the period from 2009 to 2013.
The total number of production of electronic items is maximum in the year
2011
2013
2009
2010


