 Multiple Choice Questions
Study the graph carefully to answer these questions.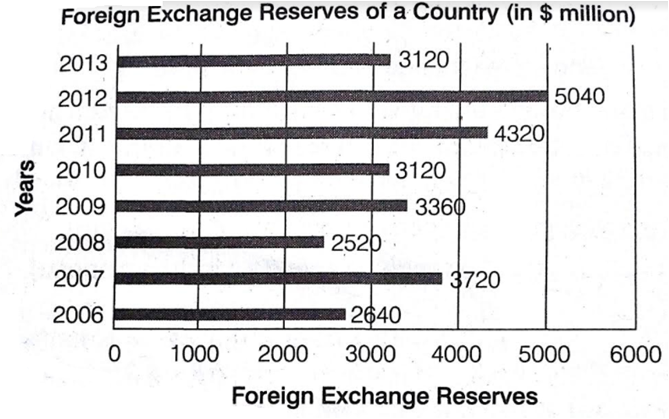
The foreign exchange reserve in 2012 was how many times that in 2009?
0.7
1.2
1.4
1.4
Study the graph carefully to answer these questions.
What was the percentage increase in the foreign reserves in 2012 over 2008?
100%
150%
200%
200%
Study the graph carefully to answer these questions.
The ratio of the number of years, in which the foreign exchange reserves are above the average reserves, to those in which reserves are below the average reserves is
2:6
3:4
3:5
3:5
Study the following bar diagram and answer the questions.
Electricity units consumed by a family in two consecutive years during July to November.
The maximum difference in the units consumption between these two years has been found in the month of
August
July
November
November
Study the following bar diagram and answer the questions.
Electricity units consumed by a family in two consecutive years during July to November.
In how many months in 2012, the consumption of electric units was more than the average units consumption in that year?
2
4
5
5
Study the following bar diagram and answer the questions.
Electricity units consumed by a family in two consecutive years during July to November.
The average electric consumption by the family during these 5 months in 2013 is
440 units
450 units
400 units
400 units
Study the following bar diagram and answer the questions.
Electricity units consumed by a family in two consecutive years during July to November.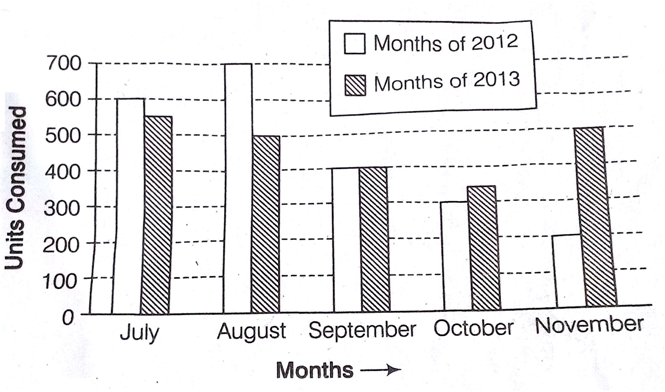
The total units consumption in the year 2013 during these 5 months, in respect of the same in the previous year has been
decreased by 2.27%
increased by 2.22%
found unaltered
found unaltered
Which of the following graphical representations of data represents cumulative frequencies?
Histogram
Frequency polygon
Ogive
Ogive
Study the following graph and answer the questions. 
From 1991 to 1992, what was the approximate percentage reduction in import of crude oil?
22
18
8
8
Study the following graph and answer the questions. 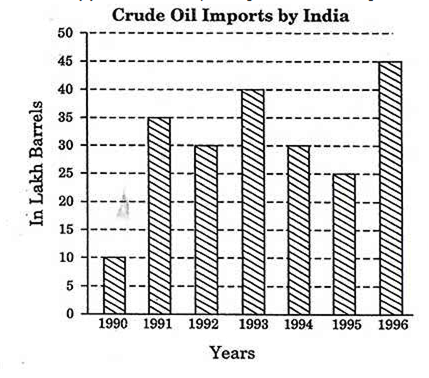
In how many years were the imports higher than the average value of imports?
1
2
3
3


