 Multiple Choice Questions
Study the following graph and answer the questions. 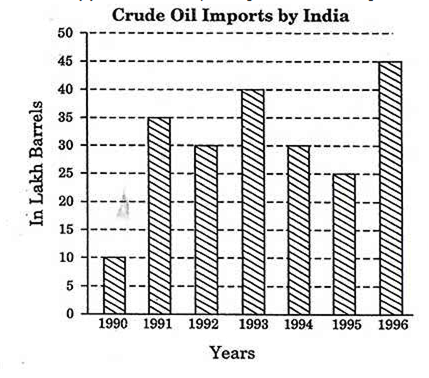
If the rate of one barrel of crude oil was ₹ 25.60 in 1995, then what was the total value of imports (in ₹) in that year?
64 crore
64 lakh
6.4 crore
6.4 crore
Study the following graph and answer the questions. 
From year 1995 to the year 1996, what was the percentage increase in imports of crude oil?
180
60
90
90
Study the following bar graph carefully and answer the given questions.
The following bar graph shows the yield per acre of six countries in South Asia.
The yield per acre of India is what percent more than that of Pakistan?
25%
50%
75%
75%
Study the following bar graph carefully and answer the given questions.
The following bar graph shows the yield per acre of six countries in South Asia.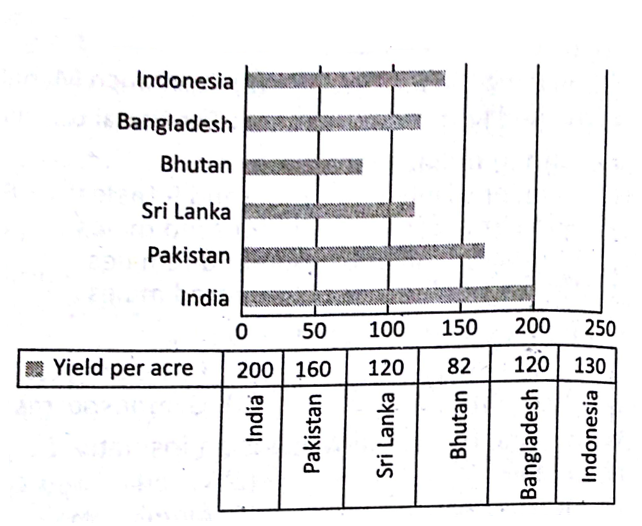
If the yield per acre is arranged in ascending order, then what is the difference between the yield per acre of first three countries and last three countries?
168
172
182
182
Study the following bar graph carefully and answer the given questions.
The following bar graph shows the yield per acre of six countries in South Asia.
The yield per acre produced by Bangladesh is what percent of the total number of yield per acre produced by all countries?
14%
13.5%
14.8%
14.8%
Study the following bar-diagram carefully and answer the questions. The bar graph given below shows the foreign exchange reserves of a country (in million US $) from 1991 - 1992 to 1998 - 1999.
The ratio of the number of years, in which the foreign exchange reserves are above the average reserves, to those in which the reserves are below the average reserves is
2 : 6
3 : 4
3 : 5
3 : 5
Study the following bar-diagram carefully and answer the questions. The bar graph given below shows the foreign exchange reserves of a country (in million US $) from 1991 - 1992 to 1998 - 1999.
The foreign exchange reserves in 1996-97 were approximately what percent of the average foreign exchange reserves over the period under review?
95%
110%
115%
115%
Study the following bar-diagram carefully and answer the questions. The bar graph given below shows the foreign exchange reserves of a country (in million US $) from 1991 - 1992 to 1998 - 1999.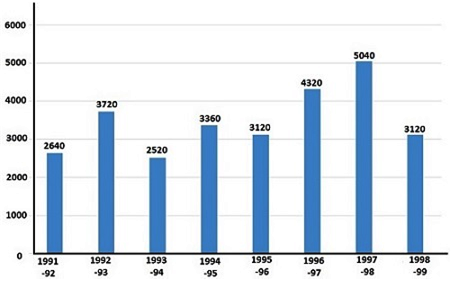
The percentage increase in the foreign exchange reserves in 1997-98 over 1993-94 is
100%
150%
200%
200%
Study the following bar-diagram carefully and answer the questions. The bar graph given below shows the foreign exchange reserves of a country (in million US $) from 1991 - 1992 to 1998 - 1999.
Ratio of the sum of foreign exchange during the years 1991-92, 1992-93, 1993-94 to that during the years 1995-96, 1996-97, 1997-98 is
31 : 35
35 : 31
37 : 52
37 : 52
Study the bar-graph given below which shows the % distribution of total expenditures of a company under various expense and answer the questions.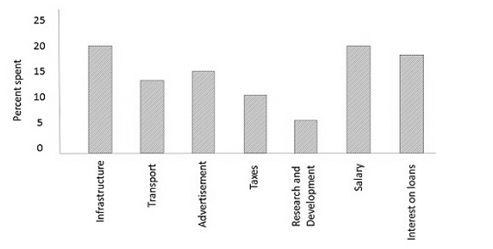
The expenditures on the interest on loans is more than the expenditures on transport by
5%
10%
40%
40%


