 Multiple Choice Questions
Study the bar-graph given below which shows the % distribution of total expenditures of a company under various expense and answer the questions.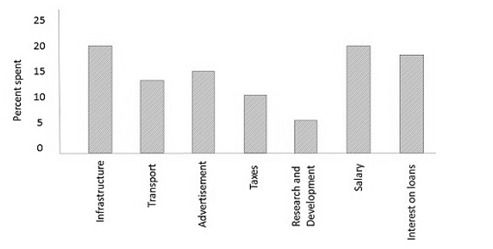
If the interest on loans amounted to ₹ 2.45 crores, then the total amount of expenditure on advertisement, taxes and research and development is
7 crores
4.2 crores
5.4 crores
5.4 crores
Study the bar-graph given below which shows the % distribution of total expenditures of a company under various expense and answer the questions.
The ratio of the total expenditure on infrastructure and transport to the total expenditure on taxes and interest on loans is:
5 : 4
8 : 7
9 : 7
9 : 7
Study the bar-graph given below which shows the % distribution of total expenditures of a company under various expense and answer the questions.
If the total expenditure of the company is ₹ 20 crores, then the ratio of expenditure on transport to that on salary is
5 : 4
4 : 5
5 : 8
5 : 8
The bar graph shows the production of table fans in a factory during one week. Study the bar graph and answer the questions.
The maximum production exceeds the minimum production by
400
420
500
500
The bar graph shows the production of table fans in a factory during one week. Study the bar graph and answer the questions.
The average production of table fan in that week is
370
280
300
300
The bar graph shows the production of table fans in a factory during one week. Study the bar graph and answer the questions.
Ratio of the total production of table fans in the factory from Monday to Wednesday to that from Thursday to Saturday is
19 : 26
26 : 19
29 : 16
29 : 16
The bar graph shows the production of table fans in a factory during one week. Study the bar graph and answer the questions.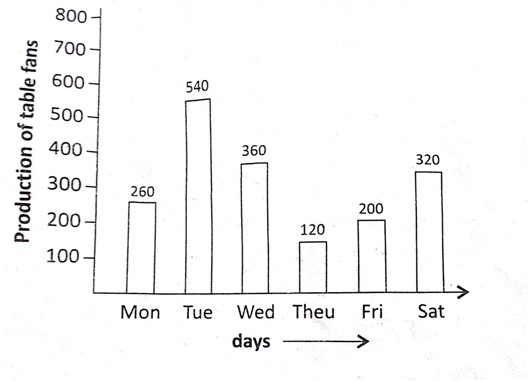
The average production of table fans on Monday and Tuesday exceeds the average production of table fans during the week by
150 fans
100 fans
140 fans
140 fans
In these questions, study the figure and answer the questions.
The following figure shows the number of students (in thousands) admitted and passed out per year in a college during years 2000 to 2004.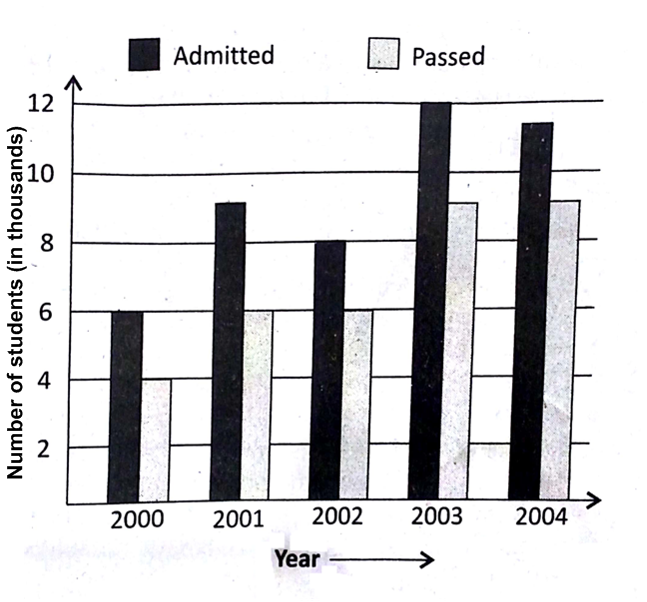
The percent increase in the number of students admitted in the year 2003 over that in 2001 is
133.3%
33.3%
40.3%
40.3%
In these questions, study the figure and answer the questions.
The following figure shows the number of students (in thousands) admitted and passed out per year in a college during years 2000 to 2004.
During 2000 to 2003, the ratio of the total number of the students passed out to the total number of students admitted is


2000 and 2001
2003 and 2004
2001 and 2002
2001 and 2002


