 Short Answer Type
Define an indifference curve. Explain why an indifference curve is downward sloping from left to right.
When price of good is Rs 7 per unit a consumer buys 12 units. When price falls to Rs6 per unit he spends Rs 72 on the good. Calculate price elasticity of demand by using the percentage method. Comment on the likely shape of demand curve based on this measure of elasticity.
What does the Law of variable Proportions show? State the behaviour of total product according to this law.
The law of variable proportions state that as the quantity of one factor is increased, keeping the other factors fixed, the marginal product of that factor will eventually decline. This means that up to the use of a certain amount of variable factor, marginal product of the factor may increase and after a certain stage it starts diminishing.
Assumptions of Law of Variable Proportions:
1. Constant State of Technology: First, the state of technology is assumed to be given and unchanged. If there is an improvement in the technology, then the marginal product may rise instead of diminishing.
2. Fixed Amount of Other Factors: Secondly, there must be some inputs whose quantity is kept fixed. It is only in this way that we can alter the factor proportions and know its effects on output. The law does not apply if all factors are proportionately varied.
3. Possibility of Varying the Factor proportions: Thirdly, the law is based upon the possibility of varying the proportions in which the various factors can be combined to produce a product. The law does not apply if the factors must be used in fixed proportions to yield a product.
Behaviour of TP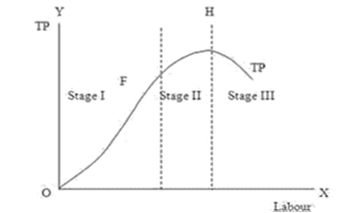
| Stages | Stage Name | TP | Range |
| I | Stage of increasing return | TP increases at an increasing rate till F | From O to point F |
| II | Stage of diminishing return | Increases at a decreasing rate and attains maximum at H | From F to point H |
| III | Stage of negative return. | TP starts to fall | From H onwards |
Explain how changes in prices of other products influence the supply of a given product.
 Long Answer Type
Explain the conditions of a producer’s equilibrium in terms of marginal cost and marginal revenue. Use diagram.
Market for a good is in equilibrium. There is simultaneous increase both in demand and supply of the good. Explain its effect on market price.
Market for a good is in equilibrium. There is simultaneous decrease both in demand and supply of the good. Explain its effect on market price.


 Switch


