 Short Answer Type
Define an indifference curve. Explain why an indifference curve is downward sloping from left to right.
When price of good is Rs 7 per unit a consumer buys 12 units. When price falls to Rs6 per unit he spends Rs 72 on the good. Calculate price elasticity of demand by using the percentage method. Comment on the likely shape of demand curve based on this measure of elasticity.
What does the Law of variable Proportions show? State the behaviour of total product according to this law.
Explain how changes in prices of other products influence the supply of a given product.
 Long Answer Type
Explain the conditions of a producer’s equilibrium in terms of marginal cost and marginal revenue. Use diagram.
Market for a good is in equilibrium. There is simultaneous increase both in demand and supply of the good. Explain its effect on market price.
The simultaneous increase in demand and supply affects the equilibrium price and output depending on the magnitude of the change in demand and supply. The simultaneous increase in the demand and supply can be bifurcated into the following three conditions.
i. When Demand and Supply Increase in the Same Proportion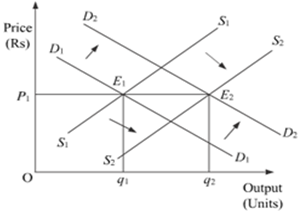
According to the diagram, E1 is the initial equilibrium with equilibrium price P1 and equilibrium output q1.
Now let us suppose the demand increases to D2D2 and the supply increases to S2S2 by the same proportion to that of demand. The new demand curve and the new supply curve intersect at point E2, which is the new equilibrium point. At the new equilibrium point, new equilibrium output is q2, while the equilibrium price remains the same at P1. Thus, an increase in the demand and the supply by same proportion leaves the equilibrium price unchanged.
ii. When Demand Increases More than Increase in Supply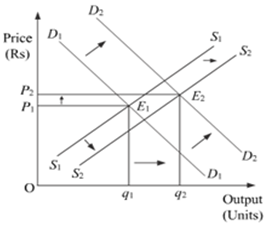
The initial demand curve and the initial supply curve intersect each other at point E1, with initial equilibrium price P1 and initial equilibrium output Q1.
Now let us suppose that demand increases and thereby demand curve shifts to D2. Simultaneously, the supply also rises and the supply curve shift to S2. However, the increase in the supply is less than the increase in the demand. The new supply curve and the new demand curve intersect each other at point E2, with higher equilibrium price P2 and higher equilibrium output Q2. Thus, when the demand increases more than the increase in supply, the equilibrium price rises.
iii. When Demand Increases but Lesser than the Increase in Supply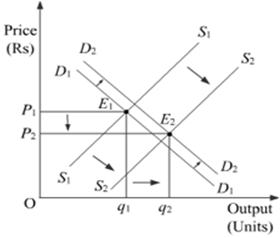
Let the initial equilibrium be at point E1, with the equilibrium price P1 and the equilibrium output Q1. Now, suppose that the demand increases to D2 and supply increases to S2. However, the increase in supply is more than that of the increase in demand. The new demand curve D2 and the new supply curve S2 intersect at point E2, with lower equilibrium price P2. Thus, when the increases in demand is less than the increase in supply, the equilibrium price falls.
Market for a good is in equilibrium. There is simultaneous decrease both in demand and supply of the good. Explain its effect on market price.


 Switch


