 Multiple Choice Questions
A boat is moving away from an observation tower. It makes an angle of depression of 60° with an observer's eye when at a distance of 50 m from the tower. After 8 sec, the angle of depression becomes 30°. By assuming that it is running in still water, the approximate speed of the boat is
33 km/hr
42 km/hr
45 km/hr
50 km/hr
The bar graph given indicates the income of a firm. Study the graph and answer the questions: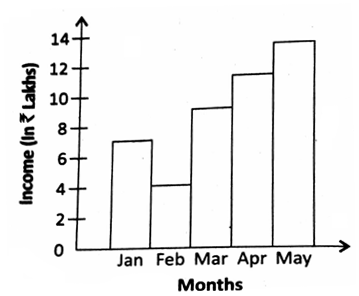
Which period shows a steady increase of income?
March to May
February to April
February to May
Insufficient data to predict
A.
March to May
Clearly, from the graph it can be concluded that from march to may, there is a steady increase of income.
The bar graph given indicates the income of a firm. Study the graph and answer the questions:
During which month, the ratio of the income to that of the previous month is the largest?
February
March
April
May
The bar graph given indicates the income of a firm. Study the graph and answer the questions:
The income in May is how many times to that of February?
3.25
4
3.5
5
The bar graph given indicates the income of a firm. Study the graph and answer the questions:
The average monthly income of the firm (in ₹ lakh) is:
7.6
6
8.8
None of these


 Switch


