 Multiple Choice Questions
Student strength of a college in Arts, Science and Commerce from 2004 - 2005 to 2007 - 2008 session are shown in the following bar graph. Study the graph and answer the questions that follow.
The ratio of average number of students in Science to the average number of students in commerce is:
10 : 7
7 : 4
12 : 5
48 : 35
B.
7 : 4
Average of Students in Science:
Average of Students in Commerce:
Required average = 1750 : 1000 = 7 : 4
Student strength of a college in Arts, Science and Commerce from 2004 - 2005 to 2007 - 2008 session are shown in the following bar graph. Study the graph and answer the questions that follow.
The increase in the number of Arts students in 2007-2008 session over that in 2005 - 2006 session is:
25%
21.42%
27.27%
37.5%
Student strength of a college in Arts, Science and Commerce from 2004 - 2005 to 2007 - 2008 session are shown in the following bar graph. Study the graph and answer the questions that follow.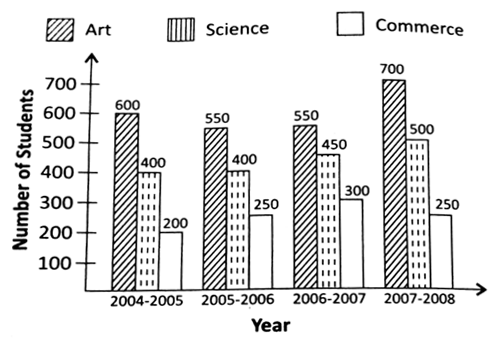
Approximate percentage of students in Science stream during the session 2006 - 2007 is:
42.31%
40.91%
41.26%
34.61%
Student strength of a college in Arts, Science and Commerce from 2004 - 2005 to 2007 - 2008 session are shown in the following bar graph. Study the graph and answer the questions that follow.
Percentage increase in total over number of students in 2007-2008 session over that in 2004 - 2005 session is approximately:
29.71%
25.65%
10.56%
20.83%


 then the value of
  is
is
 Switch


