 Multiple Choice Questions
The following line diagram represents the yearly sales figures of a company in the years 2001-2010. Examine the diagram and answer the questions 81 to 85.
By what percent did the sales in 2008 decrease in comparison to the sales in 2006?
20
18

C.
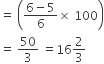
Required percent decrease:
The following line diagram represents the yearly sales figures of a company in the years 2001-2010. Examine the diagram and answer the questions 81 to 85.
The ratio of sales in 2002 to that in 2007 is
2 : 3
1 : 3
1 : 1
1 : 1
The following line diagram represents the yearly sales figures of a company in the years 2001-2010. Examine the diagram and answer the questions 81 to 85.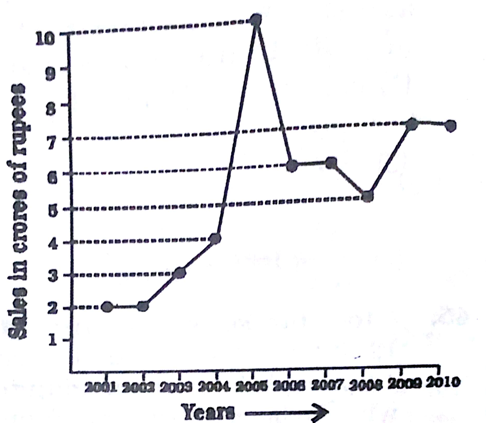
Average sales (in crores of ₹) of the company during the period 2003 - 2007 is
5.8
5
6
6
The following line diagram represents the yearly sales figures of a company in the years 2001-2010. Examine the diagram and answer the questions 81 to 85.
The percentage increase in sales in the year 2005 with respect to the previous year is
80
100
120
120
The following line diagram represents the yearly sales figures of a company in the years 2001-2010. Examine the diagram and answer the questions 81 to 85.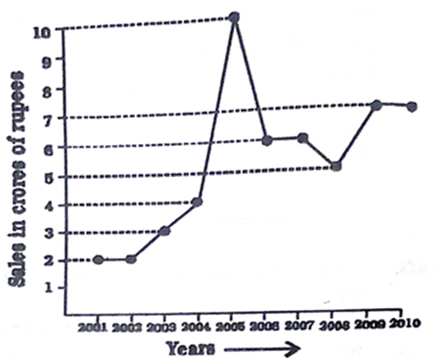
Total sales (in crores of ₹) from 2005 to 2008 is
17
27
22
22
The following table shows the number of students of 7 colleges participating in extra curricular activities:
Read the table and answer questions 86 to 90.
The difference of the range of number of students in activity IV and the average of number of students in activity III per college is
111
153
104
104
The following table shows the number of students of 7 colleges participating in extra curricular activities: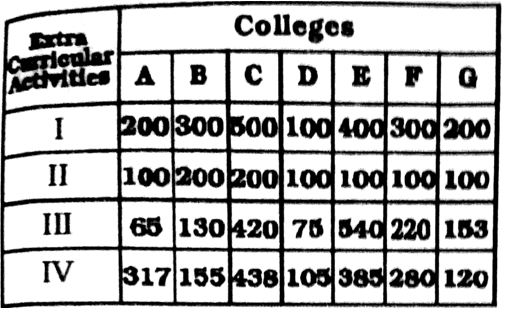
Read the table and answer questions 86 to 90.
Percentage of the number of students in activity II to that of IV is
37
42
48
48
The following table shows the number of students of 7 colleges participating in extra curricular activities:
Read the table and answer questions 86 to 90.
The median of data pertaining to activity III is
540
229
153
153
The following table shows the number of students of 7 colleges participating in extra curricular activities:
Read the table and answer questions 86 to 90.
The college in which minimum number of students participate in extra curricular activities is
D
G
F
F
The following table shows the number of students of 7 colleges participating in extra curricular activities:
Read the table and answer questions 86 to 90.
The ratio of total number of students in II and I is
1 : 2
9 : 20
19 : 7
19 : 7


 Switch


